- Ontario’s entire road network, including resource roads, spans over 250,000 kilometres. (“Resource roads” are primarily used by commercial vehicles for industrial purposes, such as agriculture, forestry, or energy.) (Government of Canada, n.d., accessed July 2025)
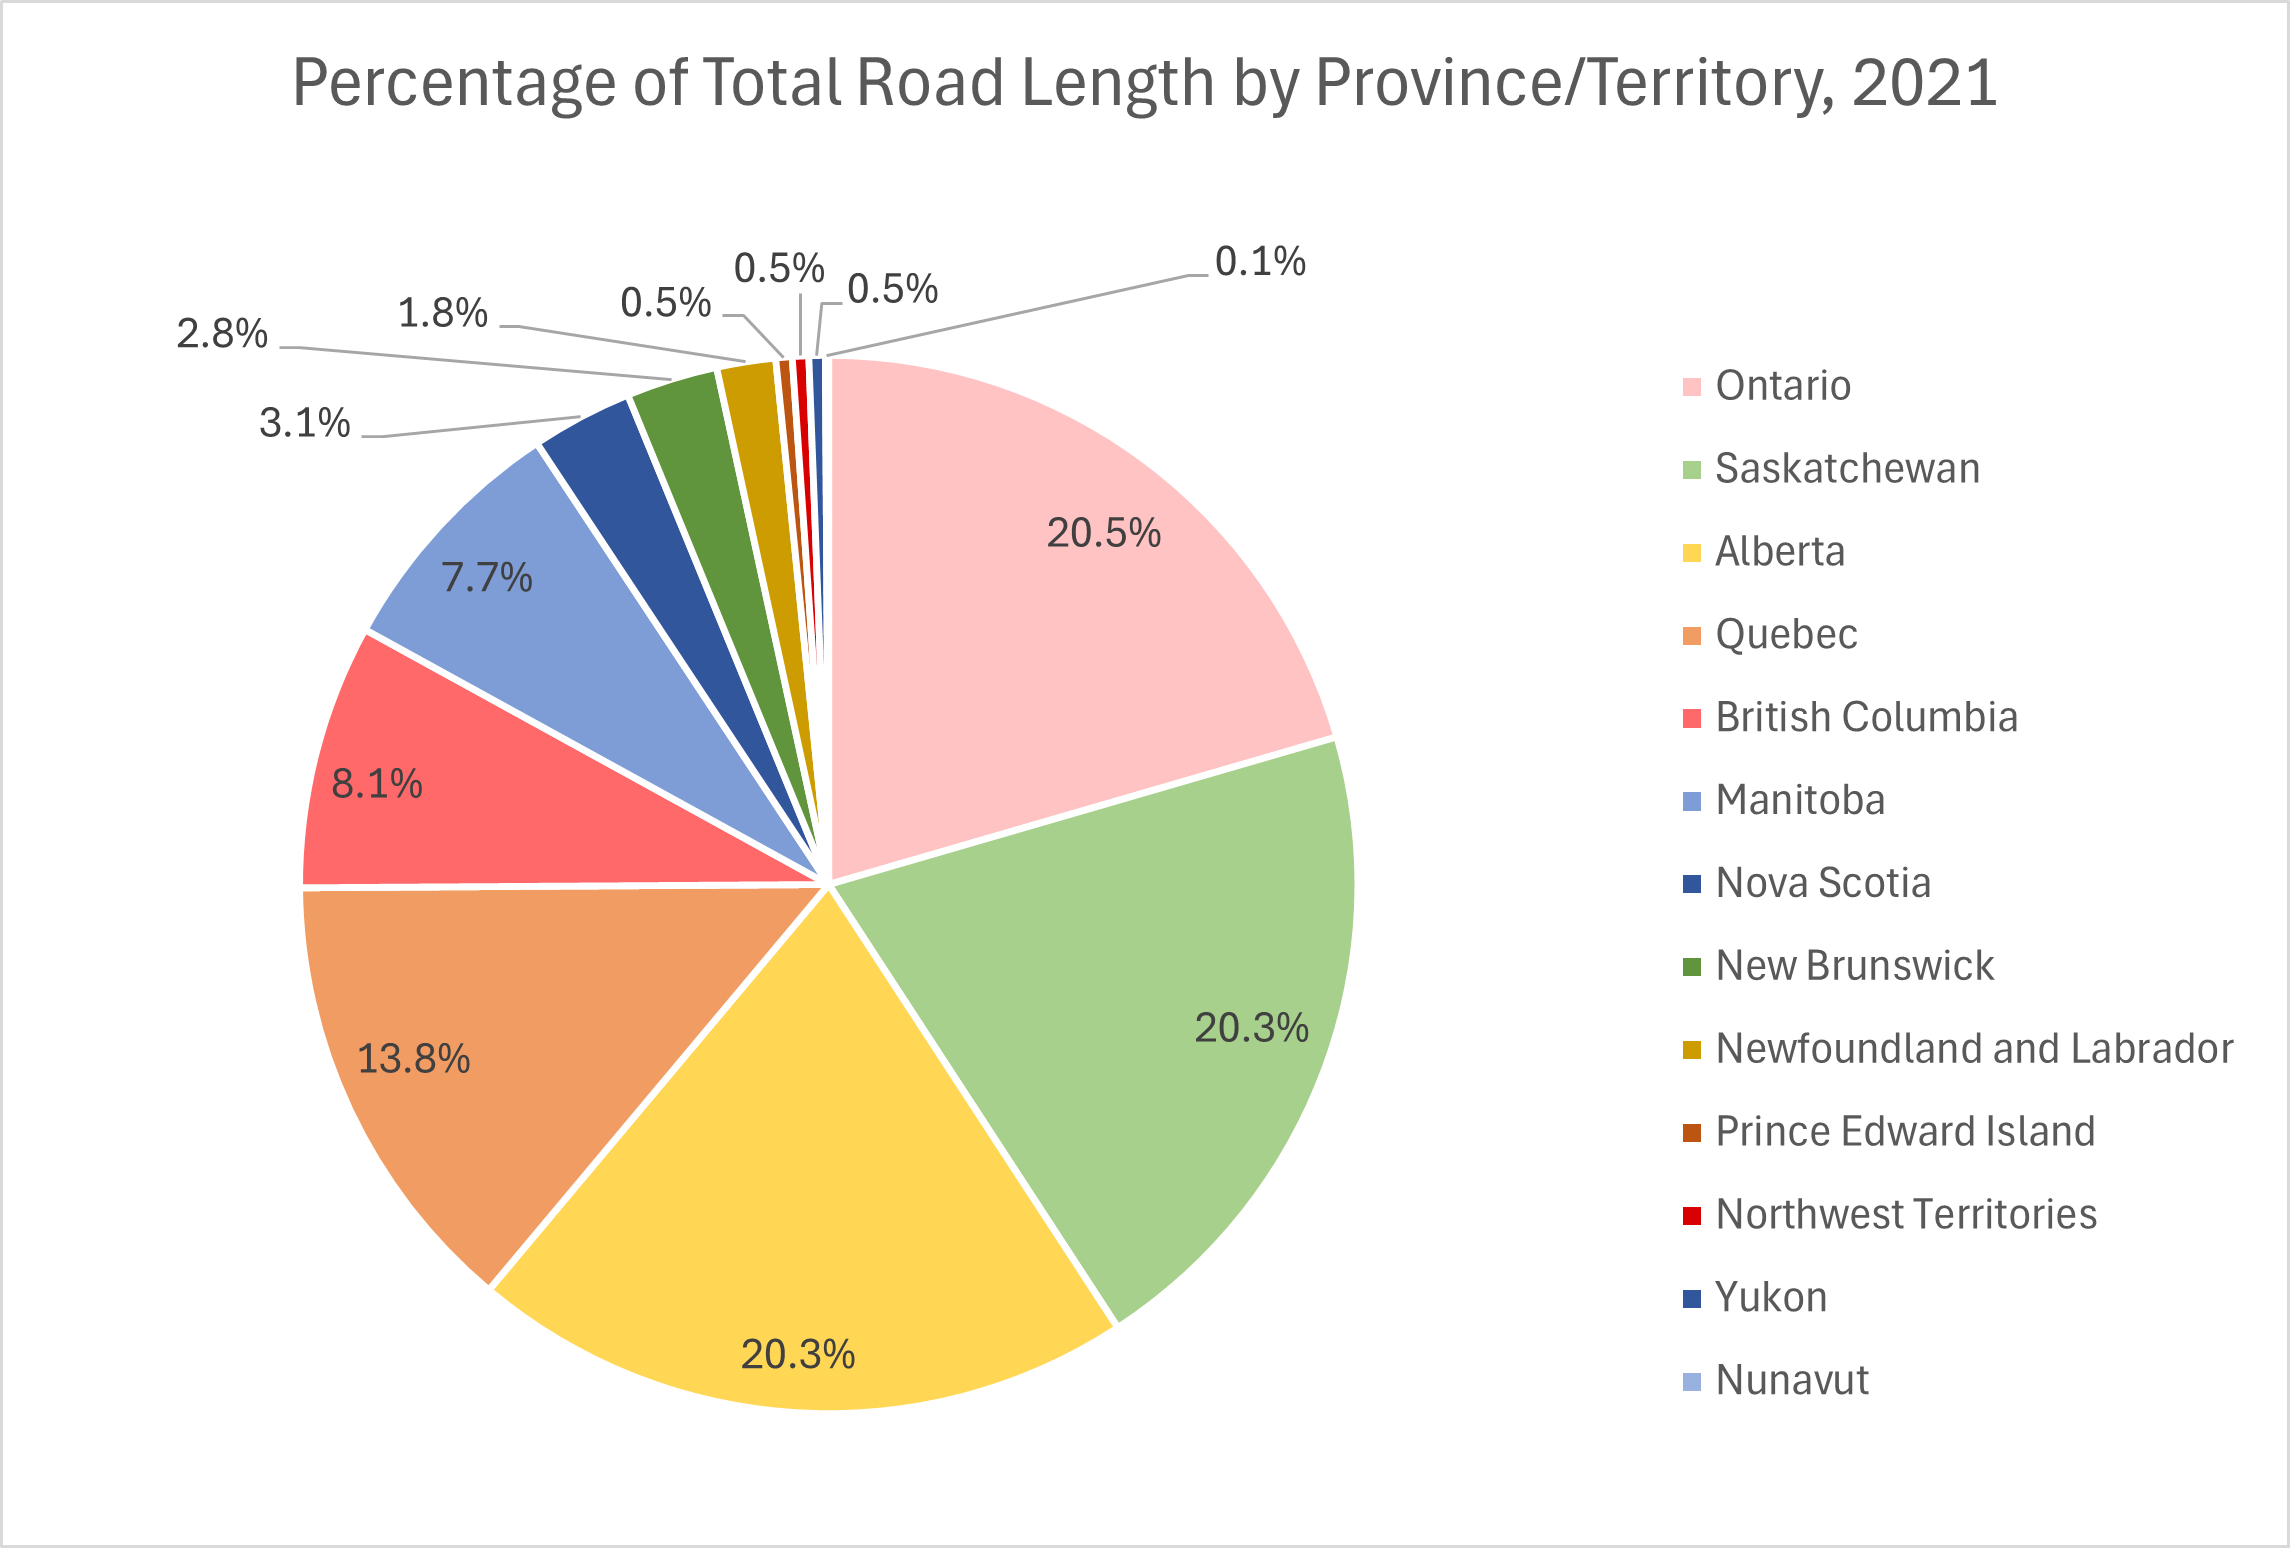
- As of 2021, Ontario’s roads accounted for 20.5% of Canada’s total road length. Ontario, Quebec, Saskatchewan, and Alberta combined accounted for 74.9% of Canada’s total road length. See the following chart. (Transport Canada, May 2025)
- The Provincial Highway Network of Ontario includes about 16,900 kilometres of roads and 2,880 bridges. These roads include the following types:
- 400-series highways: controlled-access freeways, with a total length of about 1,900 kilometres. An example is Highway 401. (400-series highways are one type of Kings Highways, so the lengths of these two types of roads tend to overlap.)
- Kings Highways: numbered highways, but not controlled access, with a total length of about 14,100 kilometres. An example is Highway 17, Ontario’s longest highway, which is about 1,964 kilometres long within Ontario. That is approximately equal to the direct-flight distance from Toronto to Miami, Florida (1,980 kilometres). (Bevers, n.d.)
- Secondary highways: about 2,400 kilometres of roads, mostly in northern Ontario.
- Tertiary roads: about 500 kilometres of gravel or remote roads. (Wikipedia contributors, July 2024)
- As of March 31, 2022, there were an estimated 11,164,837 licensed drivers in Ontario, representing about 74.7% of a total Ontario population of 14,951,835. (Ontario Ministry of Transportation, May 2023; and Statistics Canada, 2022)
- In 2023, there were 8,593,281 actively registered motor vehicles in Ontario, making up 33.4% of all actively registered motor vehicles in Canada. (Note: Starting in 2022, the number of registered motor vehicles in Ontario was revised downward to eliminate inactive registrations as the COVID-19 registration exemption ended. Counted registrations declined further as fewer vehicle owners renewed their registrations. Also, Ontario eliminated licence plate renewal fees and stickers on several types of vehicles, evidently resulting in fewer vehicle owners remembering to renew their vehicle registrations. Therefore, comparisons between active registrations in 2022 and 2023 and those in previous years should be made with caution.) (Statistics Canada, July 2025)
- In 2022, Ontario’s vehicles travelled an estimated total of 155.303 billion kilometres. This distance is about 36 times the distance from Earth to the planet Neptune at their time of closest approach. (Ontario Ministry of Transportation, April 2024)
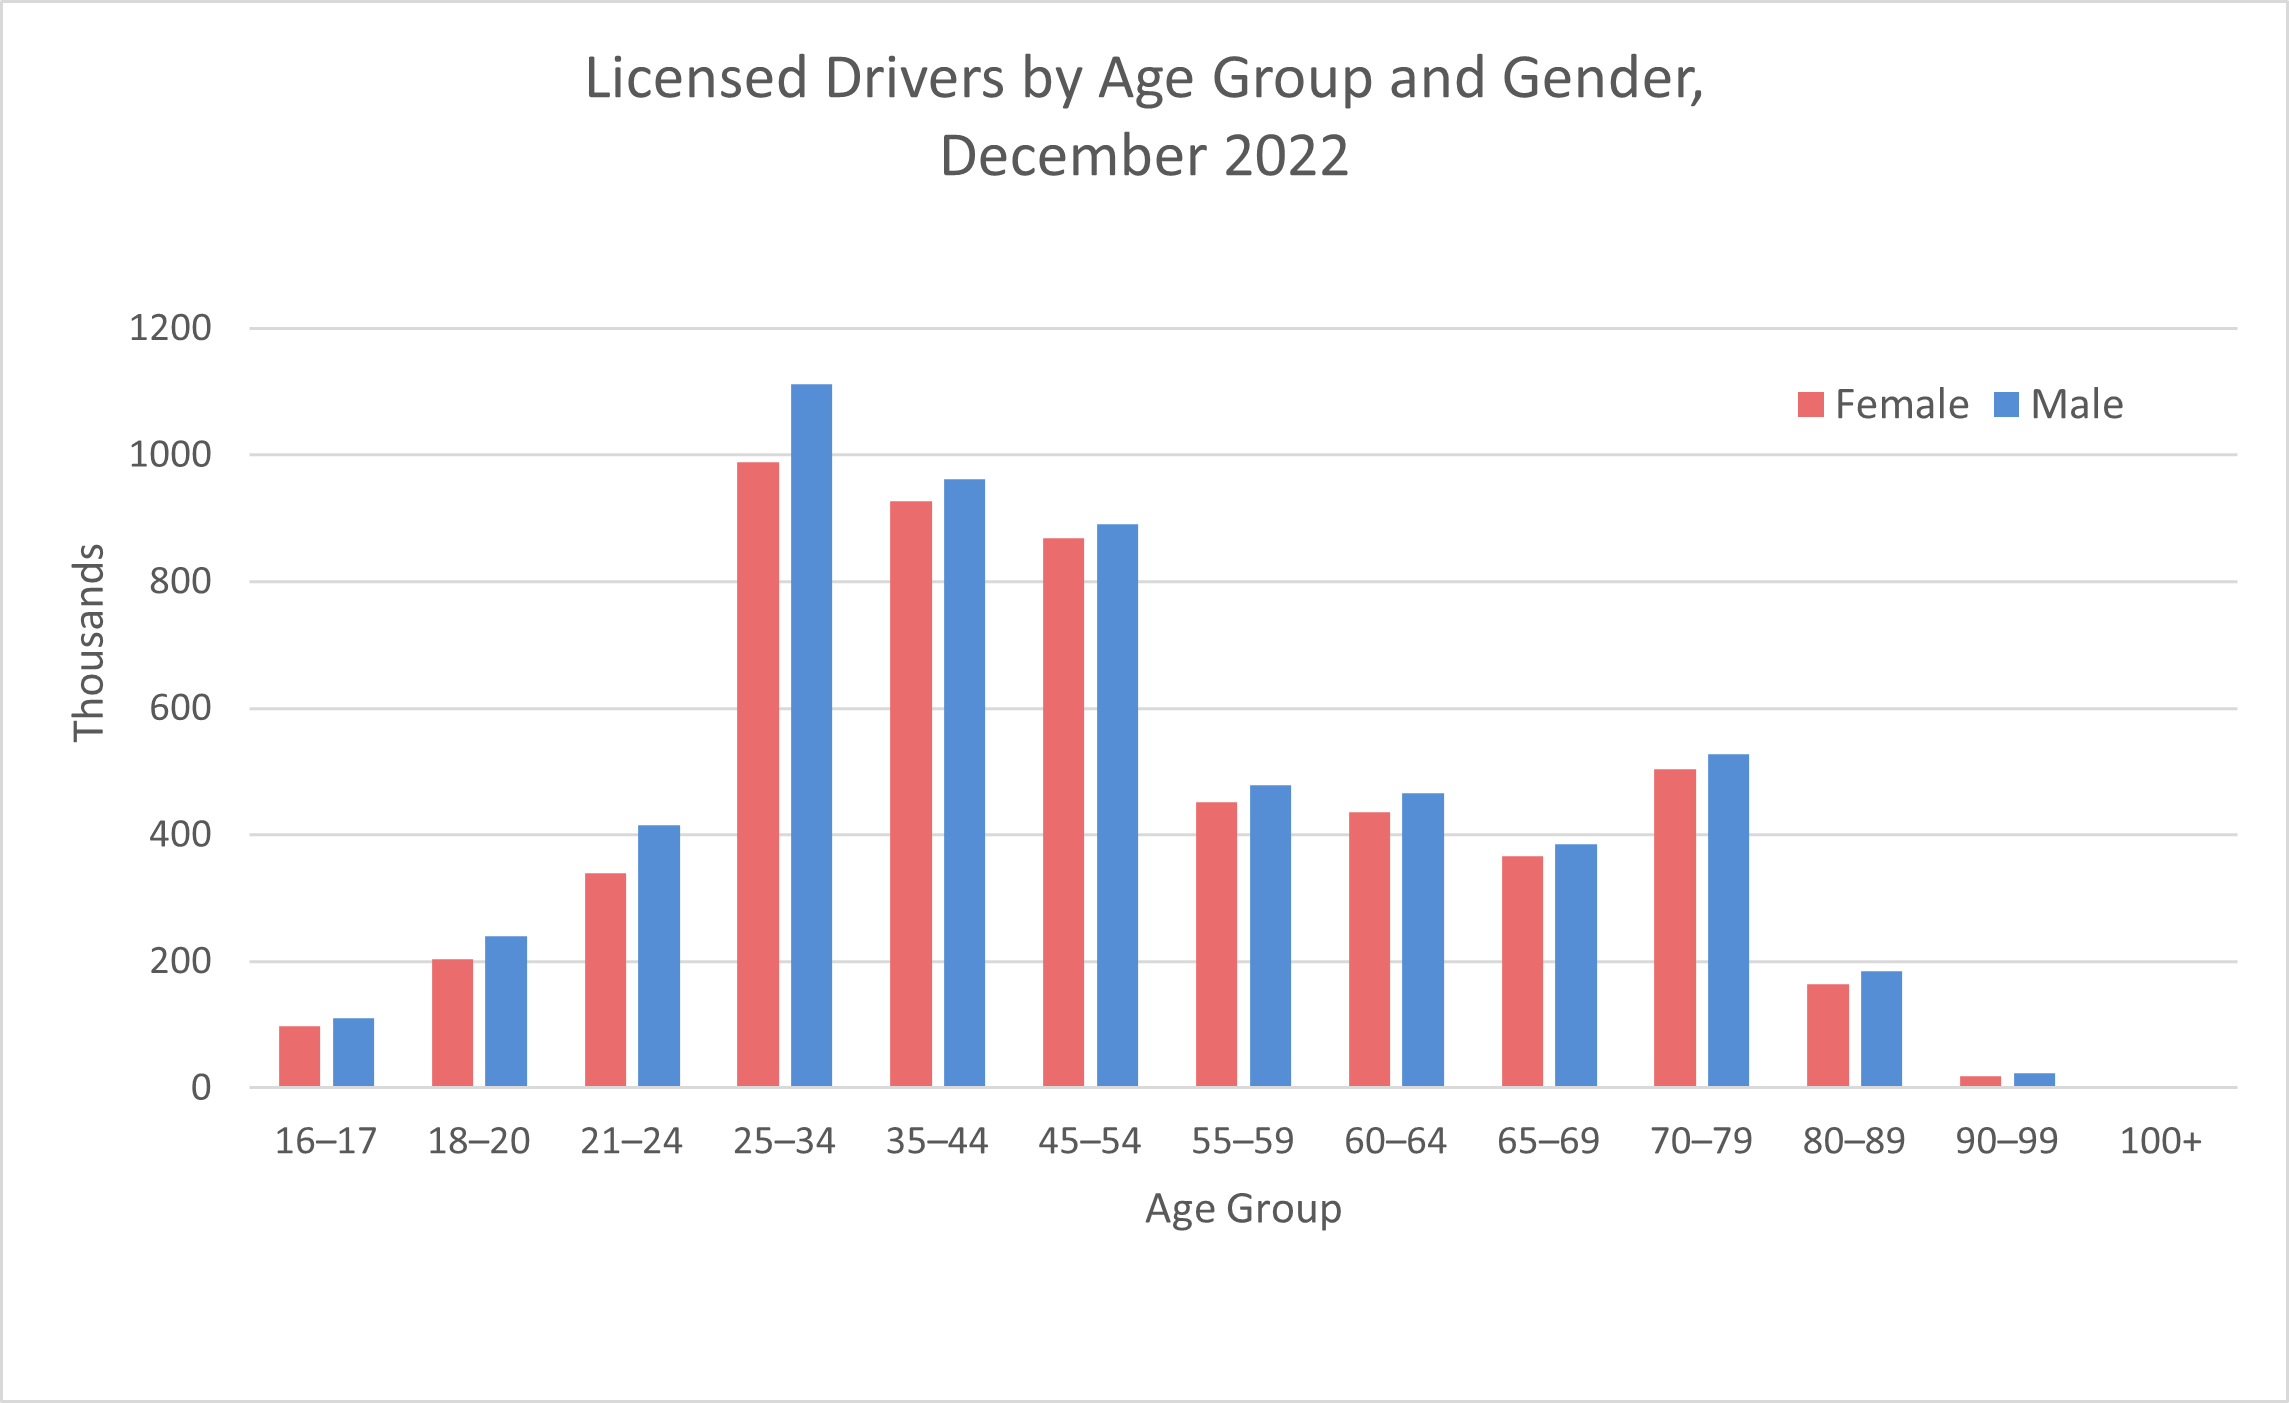
- The following chart shows the number of Ontario’s licensed drivers in 2022 by age group and gender. There were more drivers aged 25 to 34 (18.4% of all female drivers, 19.2% of all male drivers) than of any other age group. 687,477 (12.8%) of Ontario’s licensed female drivers were 70 years old or older. 735,294 (12.7%) of Ontario’s licensed male drivers were 70 years old or older. 18,240 licensed female drivers and 22,977 licensed male drivers were between 90 and 99 years of age. 105 licensed female drivers and 146 licensed male drivers were 100 years old or older. (Ontario Ministry of Transportation, 2023b)
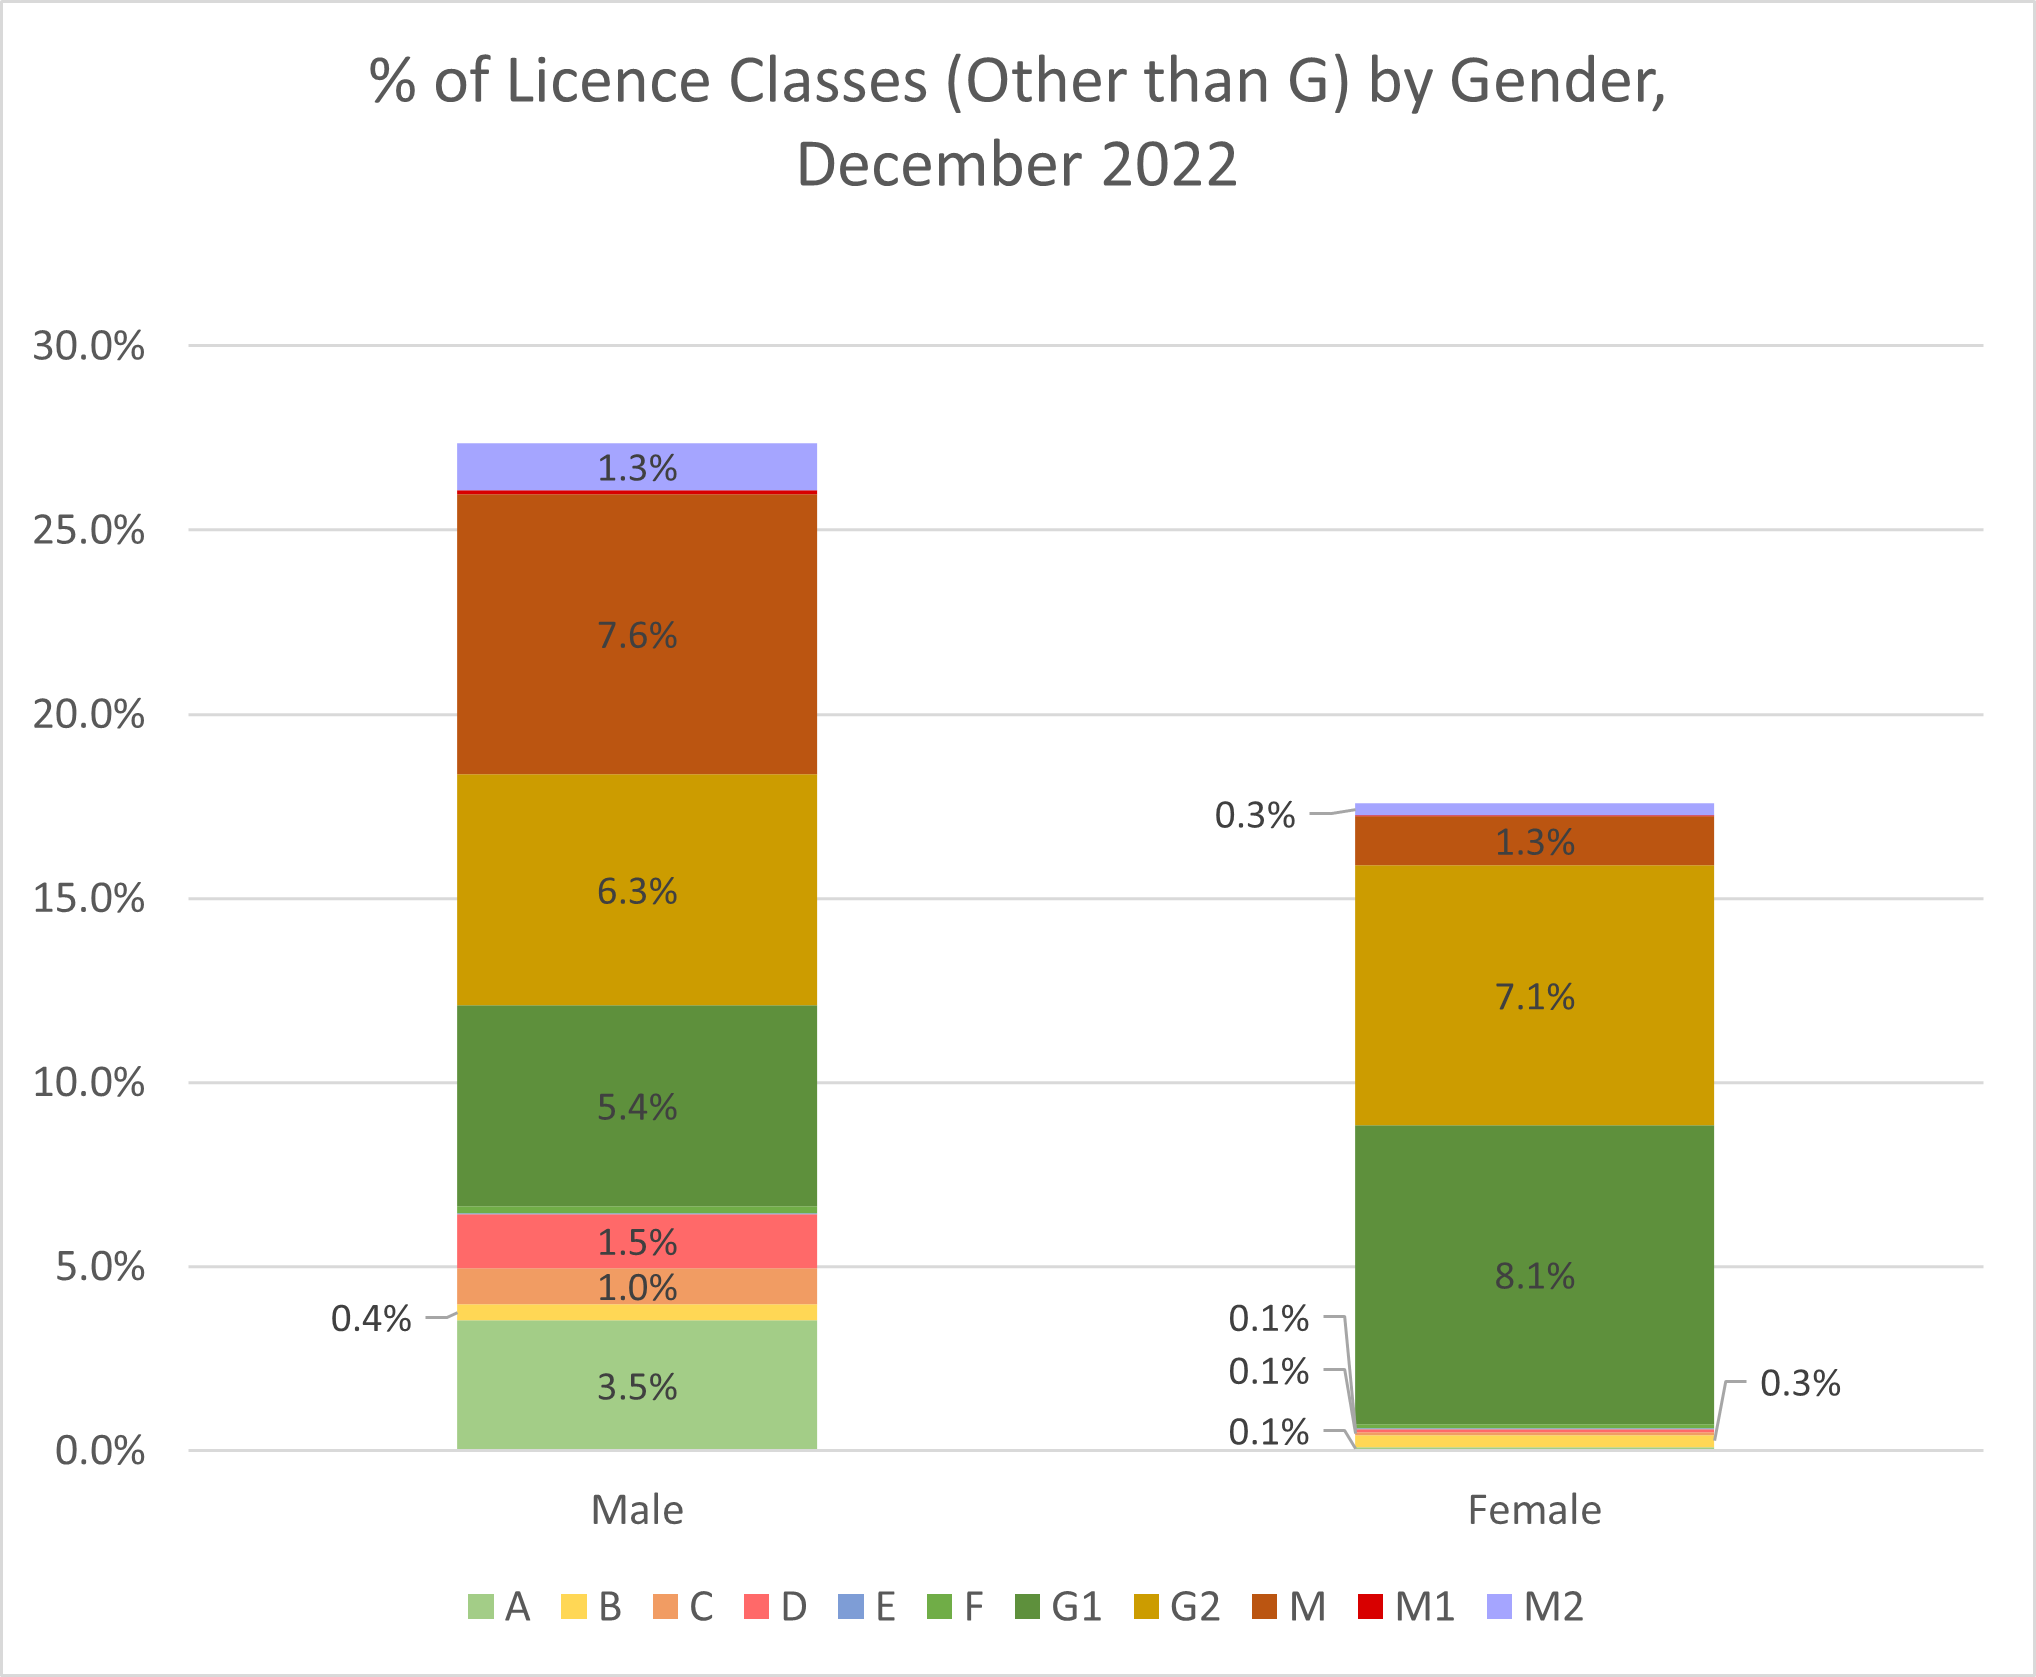
- In 2022, the vast majority of licensed Ontario drivers held Class G (car) licences (72.6% of male drivers and 82.4% of female drivers). The next most common class of licence for male drivers was Class M (motorcycle) (7.6%). However, the next most common class of licence for female drivers was G1 (car learner) (8.1%). See the following chart. (Ontario Ministry of Transportation, 2022)
- In 2023, there were 163,136 heavy-duty (11,794 kg or more) trucks, 147,657 medium-duty (4,536–11,793 kg) trucks, and 1,118,047 pickup trucks registered in Ontario. The total number of vehicles (including motorcycles and mopeds) registered in Ontario was 8,593,281 that year. (Statistics Canada, October 2024)
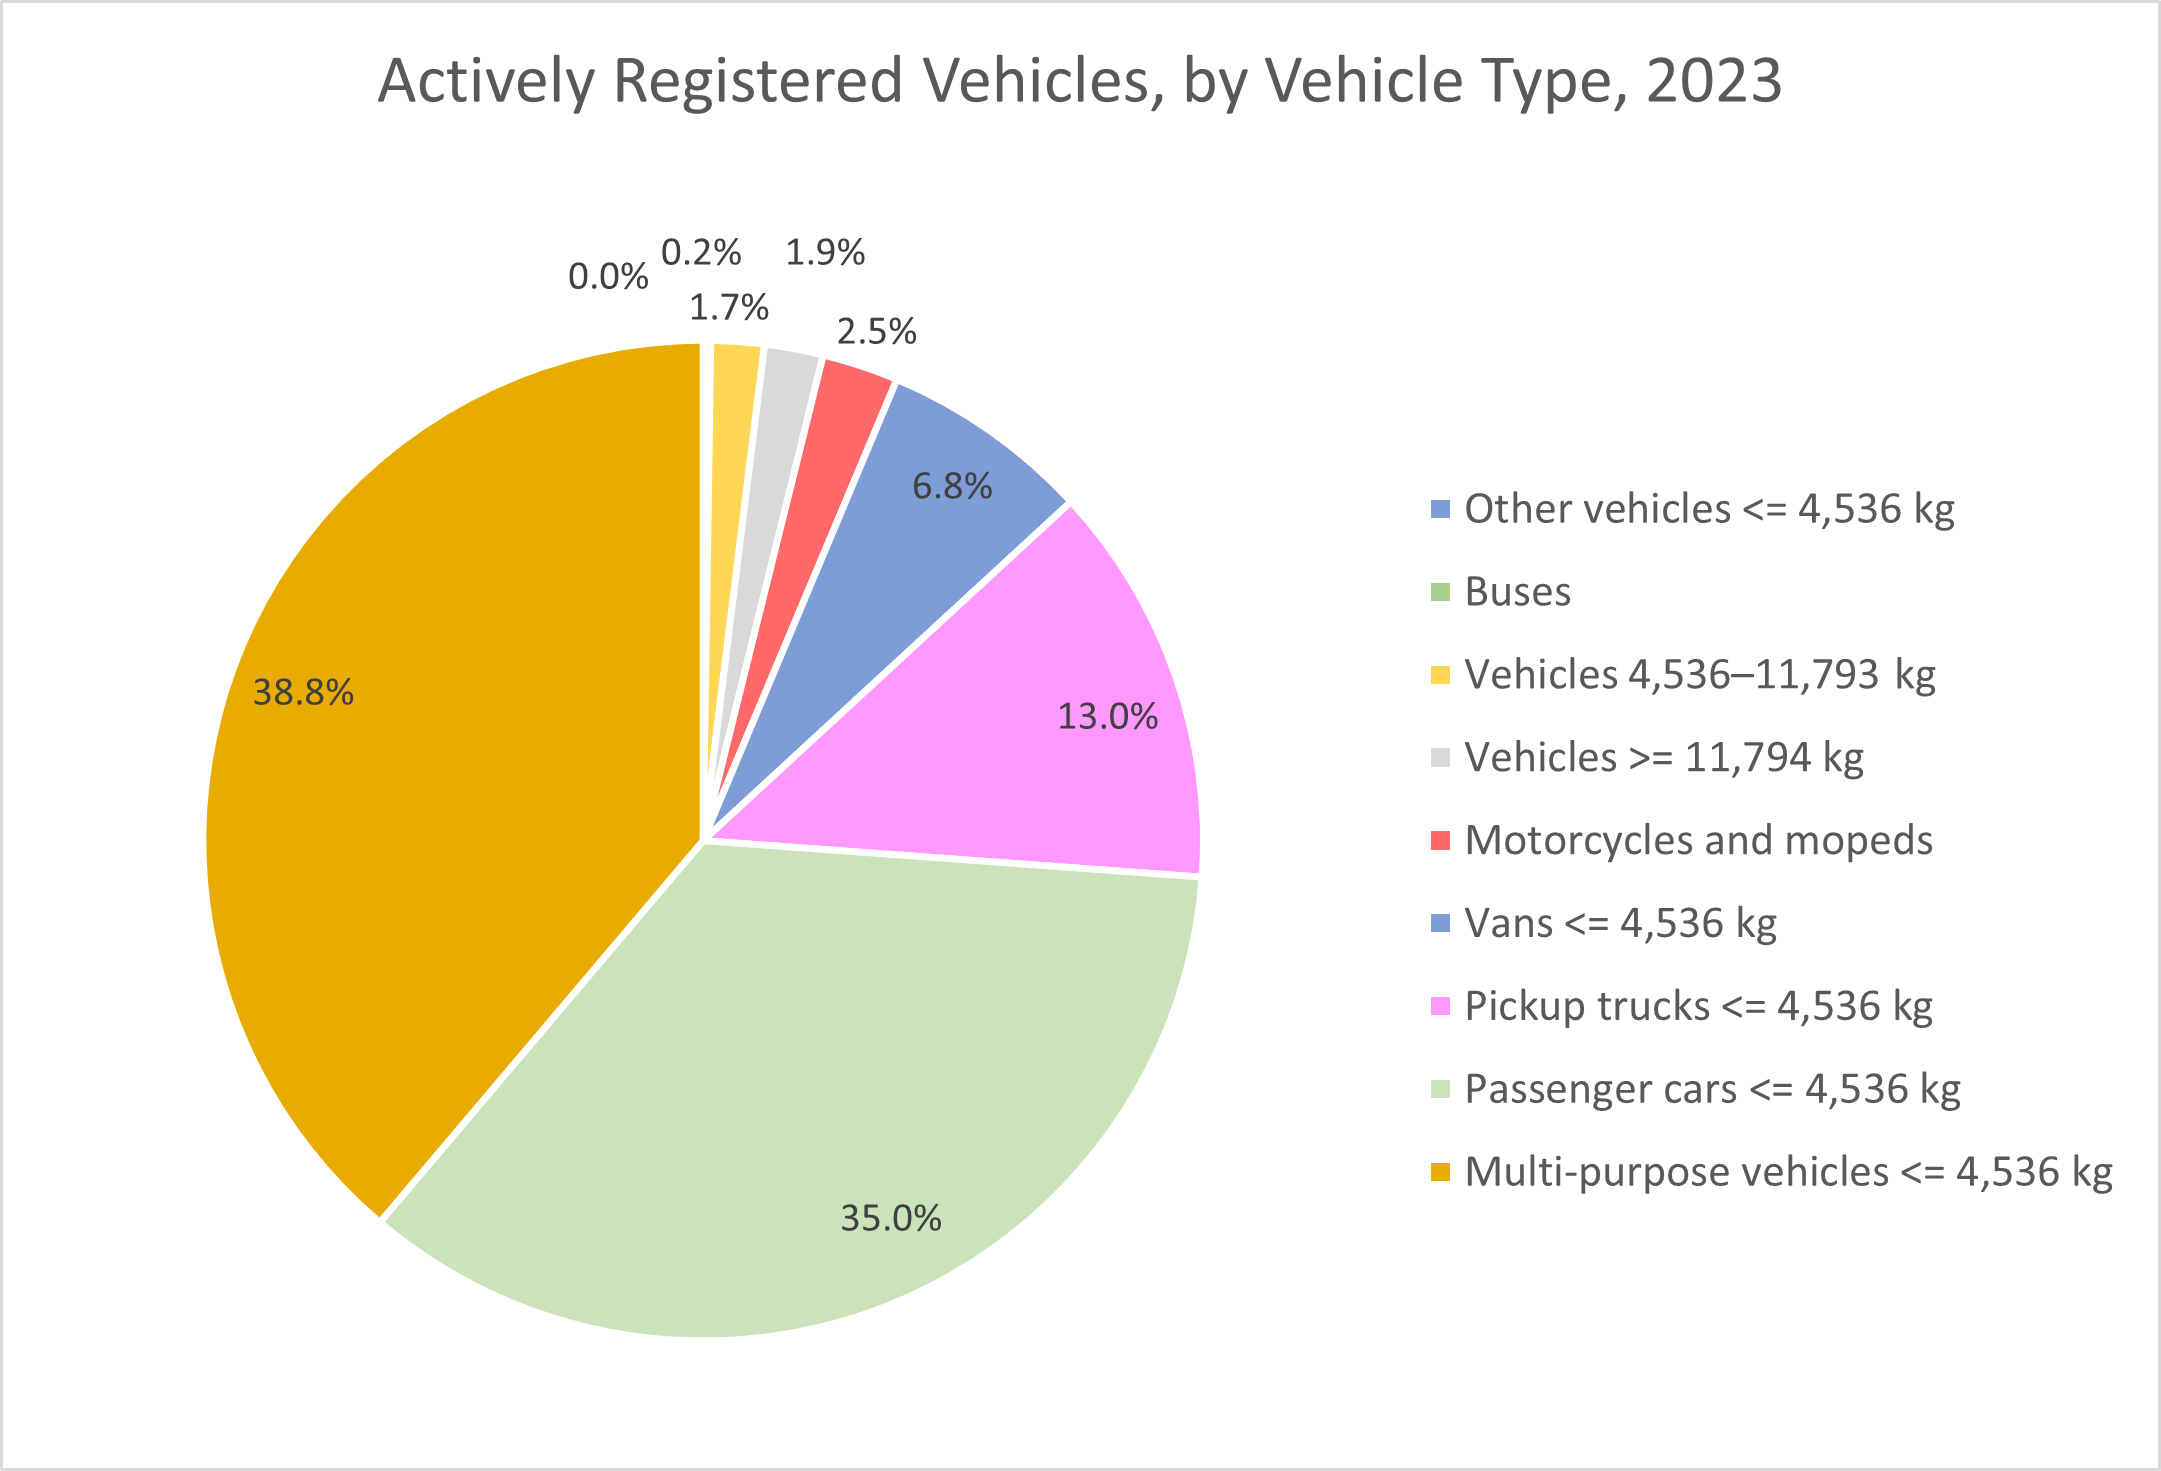
- In 2023, multi-purpose vehicles weighing 4,536 kg or less made up 38.8% of all motor vehicles actively registered in Ontario. (This category of vehicles, with more motor vehicle registrations than any other, includes SUVs and crossover vehicles.) Another 35.0% of registered motor vehicles were passenger cars (e.g., sedans and coupes) weighing 4,536 kg or less. Light pickup trucks (4,536 kg or less) made up another 13.0%. See the following chart. (Note: The category “Other vehicles” includes recreational vehicles and incomplete vehicles that require further manufacturing to become complete vehicles.) (Statistics Canada, October 2024)
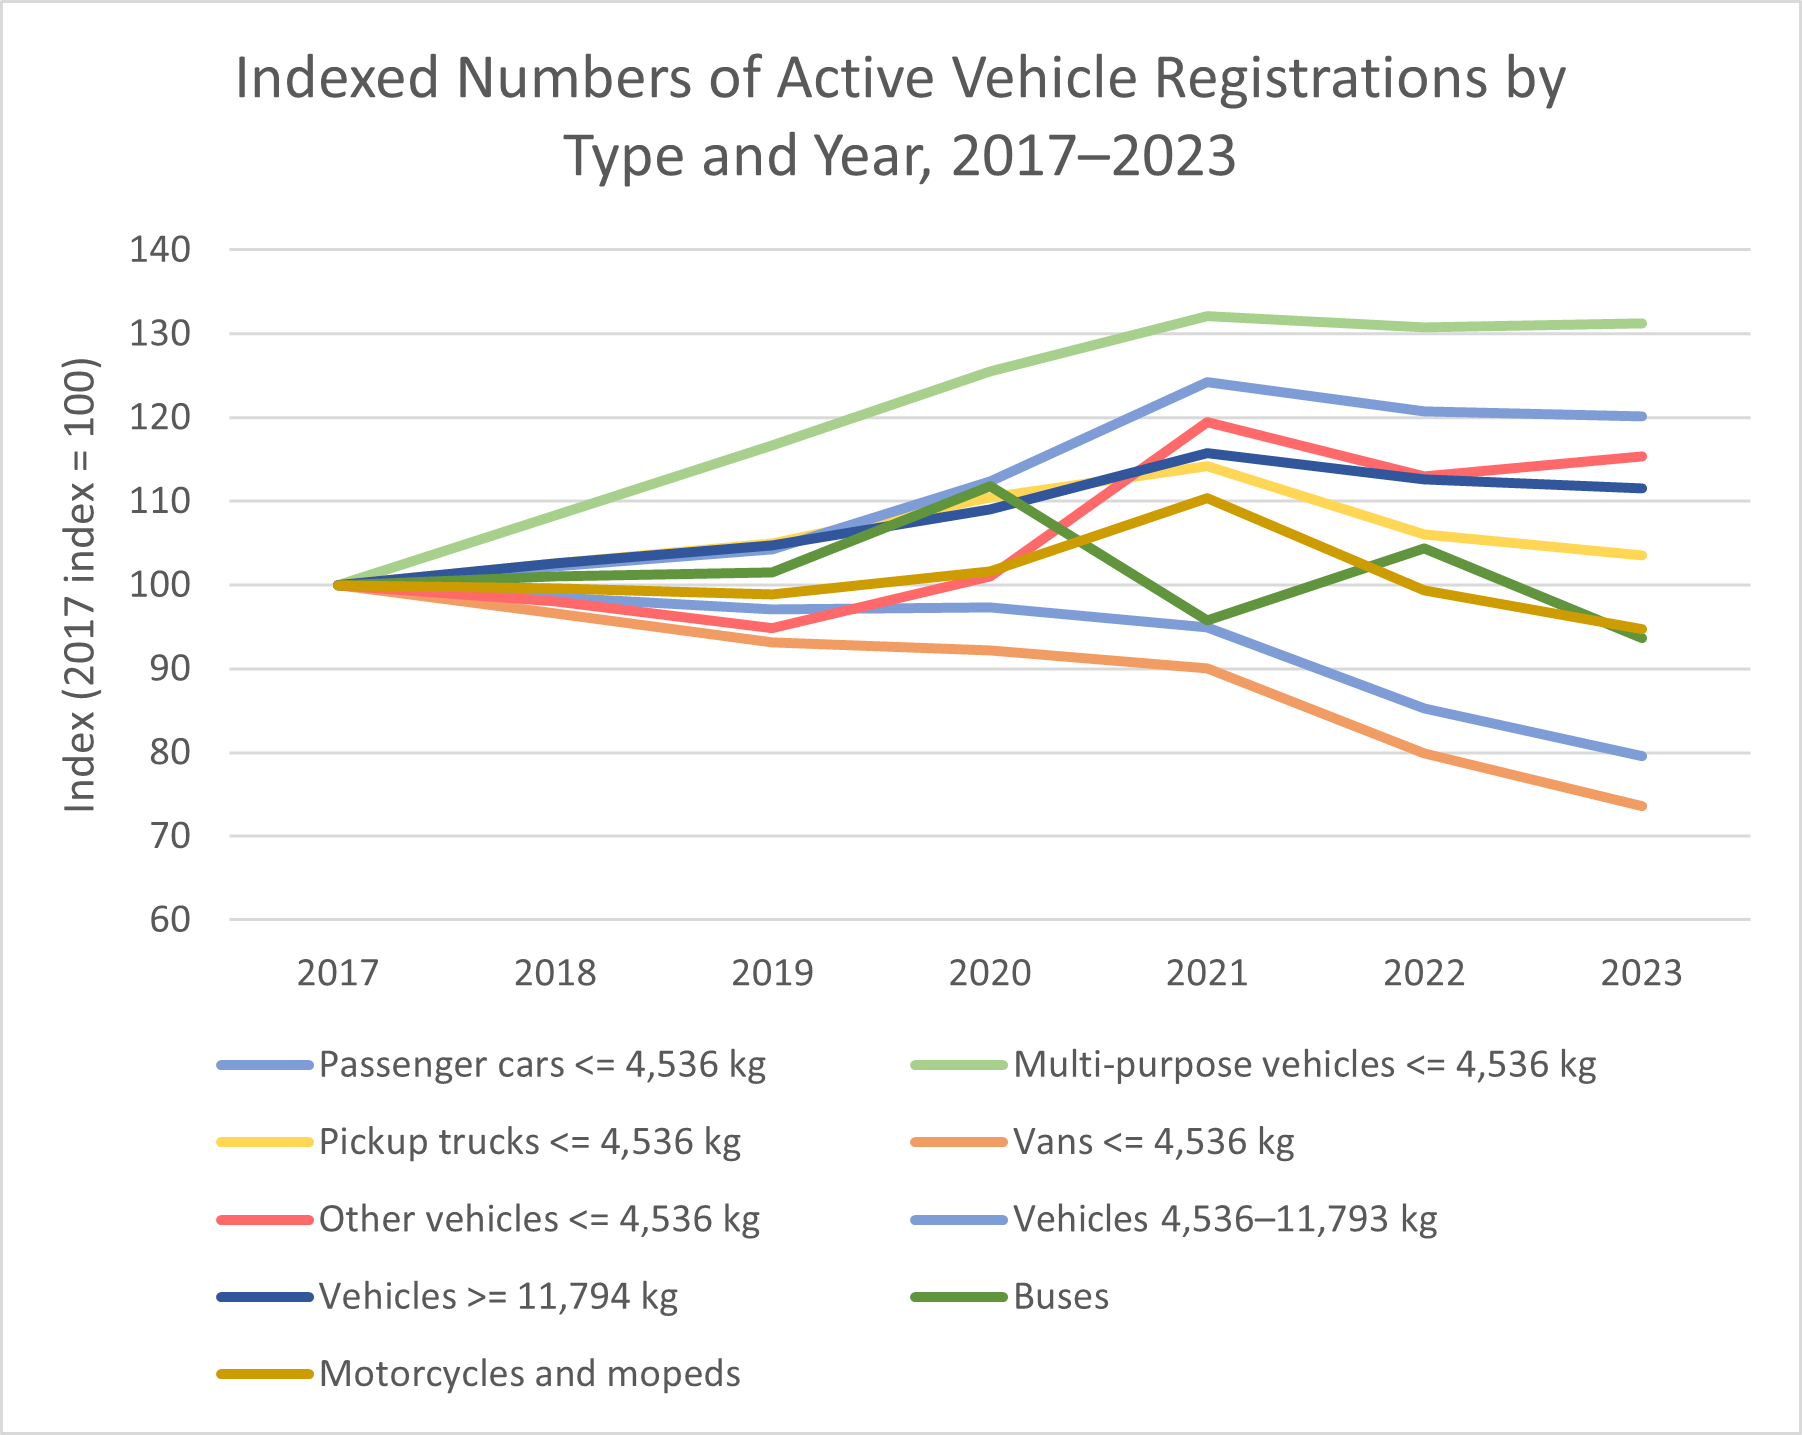
- We can also examine the trends in vehicle registrations for these types of vehicles from 2017 to 2023. With the initial index for registrations of each type of vehicle set to 100 in 2017, the trends in vehicle registrations are as shown in the following chart. There appear to be sharp declines in registrations of vans, medium-duty (4,536–11,793 kg) vehicles, and motorcycles and mopeds after 2021. However, as noted earlier, part (though not all) of these changes may be an artifact of changes to Ontario regulations, which may have directly or indirectly affected the numbers of registrations. Least affected were multi-purpose vehicles (SUVs and crossovers) because of their high popularity during 2017–2023. (Statistics Canada, October 2024)
- Most Canadian trucking companies are located in Ontario (48.3%), Quebec (14.9%), Alberta (14.5%), or British Columbia (10.9%). (Transport Canada, 2022)
- In Ontario, school vehicles (including school buses and school vans) transported 853,788 pupils daily during the 2018/2019 school year. This number increased to 865,486 during the 2019/2020 school year, but it may have been affected by the COVID-19 pandemic. At the time of this writing, data for the 2020/2021 school year is unavailable because of the pandemic. (Ontario Ministry of Transportation, 2024a)
- In Ontario in 2022, there were 559,140 convictions under the Highway Traffic Act (HTA). By far, the most common type of conviction was for speeding (60.4% of all HTA convictions). After speeding, the ten next most common types of convictions were as follows. (Ontario Ministry of Transportation, 2023b)
|
Offence |
Number of Convictions |
Percentage of Total |
|
Speeding |
337,697 |
60.4% |
|
Disobey legal sign |
22,532 |
4.0% |
|
Fail to stop at intersection |
19,775 |
3.5% |
|
No licence or improper class |
13,132 |
2.3% |
|
Fail to produce licence |
12,731 |
2.3% |
|
Drive without validated permit |
12,608 |
2.3% |
|
Careless driving |
8,578 |
1.5% |
|
Unsafe move |
8,449 |
1.5% |
|
Numbers on plate not visible |
7,282 |
1.3% |
|
Fail to surrender permit |
6,670 |
1.2% |
|
No number plate on vehicle |
6,280 |
1.1% |
- In Ontario in 2022, there were 379,729 convictions for speeding. 1,267 drivers exceeded the speed limit by more than 50 km/h:
|
Range Of Excess Speed |
Number of Speeders |
Percentage of Total Speeders |
|
1-15 km/h |
244,144 |
64.3% |
|
16-29 km/h |
87,182 |
23.0% |
|
30-49 km/h |
47,136 |
12.4% |
|
50+ km/h |
1,267 |
0.3% |
|
Total speeders |
379,729 |
100.0% |
The licence class with the highest percentage of speeders was M1; there were 573 speeding convictions (7.6%) out of 7,580 M1 holders. It is illegal for Class G1 holders (Level One learner drivers) to drive unsupervised. Nevertheless, there were 1,577 speeding convictions for G1 holders, making up 0.2% of all G1 holders. For Class G2 holders (Level Two learners), the number of speeding convictions jumped sharply to 24,273 (3.1% of all G2 holders). This suggests that thousands of learner drivers started engaging in bad driving as soon as supervision was withdrawn. (Ontario Ministry of Transportation, 2023b)
- In Ontario in 2021, there was a total of 15,017 convictions for driving-related criminal offences under the Criminal Code of Canada, of which 69.5% were related to impaired driving in some way. The following table lists the twelve driving-related criminal offences with the most convictions in 2021. (Ontario Ministry of Transportation, 2023b)
|
Offence |
Number of convictions |
Percentage of total |
|
Driving with BAC over 0.08% |
5,017 |
33.4% |
|
Impaired driving |
4,457 |
29.7% |
|
Dangerous driving |
1,411 |
9.4% |
|
Operation while prohibited |
1,385 |
9.2% |
|
Fail or refuse to provide breath or blood sample |
852 |
5.7% |
|
Fail to stop for police officer |
576 |
3.8% |
|
Fail to remain at accident, no bodily harm |
246 |
1.6% |
|
Impaired driving, causing bodily harm |
67 |
0.4% |
|
Dangerous driving, causing bodily harm |
65 |
0.4% |
|
Driving with more than 5 ng drugs in blood |
33 |
0.2% |
|
Fail to remain at accident, bodily harm |
30 |
0.2% |
|
Impaired driving, causing death |
16 |
0.1% |
- In Ontario in 2021, there were 153,751 collisions, involving 272,503 drivers and 282,350 vehicles. These collisions included 519 fatal collisions, 23,960 personal injury collisions, and 129,272 collisions involving only property damage. (Ontario Ministry of Transportation, 2024a)
- In 2021, these 153,751 collisions involved 561 fatalities (not including fatalities from ATVs and snowmobiles) and 32,507 persons injured. These fatalities included 346 drivers, 81 passengers, 121 pedestrians, and 13 other road users. (Ontario Ministry of Transportation, 2024a)
- In 2021, motor vehicles travelled an estimated 153.943 billion vehicle kilometres. The collision and fatality rates in terms of kilometres travelled were as follows:
- Collision rate: 99.88 collisions per 100 million kilometres travelled
- Fatal collision rate: 0.34 fatal collisions per 100 million kilometres travelled
- Fatality rate: 0.36 fatalities per 100 million kilometres travelled (Ontario Ministry of Transportation, 2024a)
- In terms of the number of licensed drivers, the fatality rate in 2021 was 0.52 fatalities per 10,000 licensed drivers. This was the lowest rate in North America. (Ontario Ministry of Transportation, 2024a)
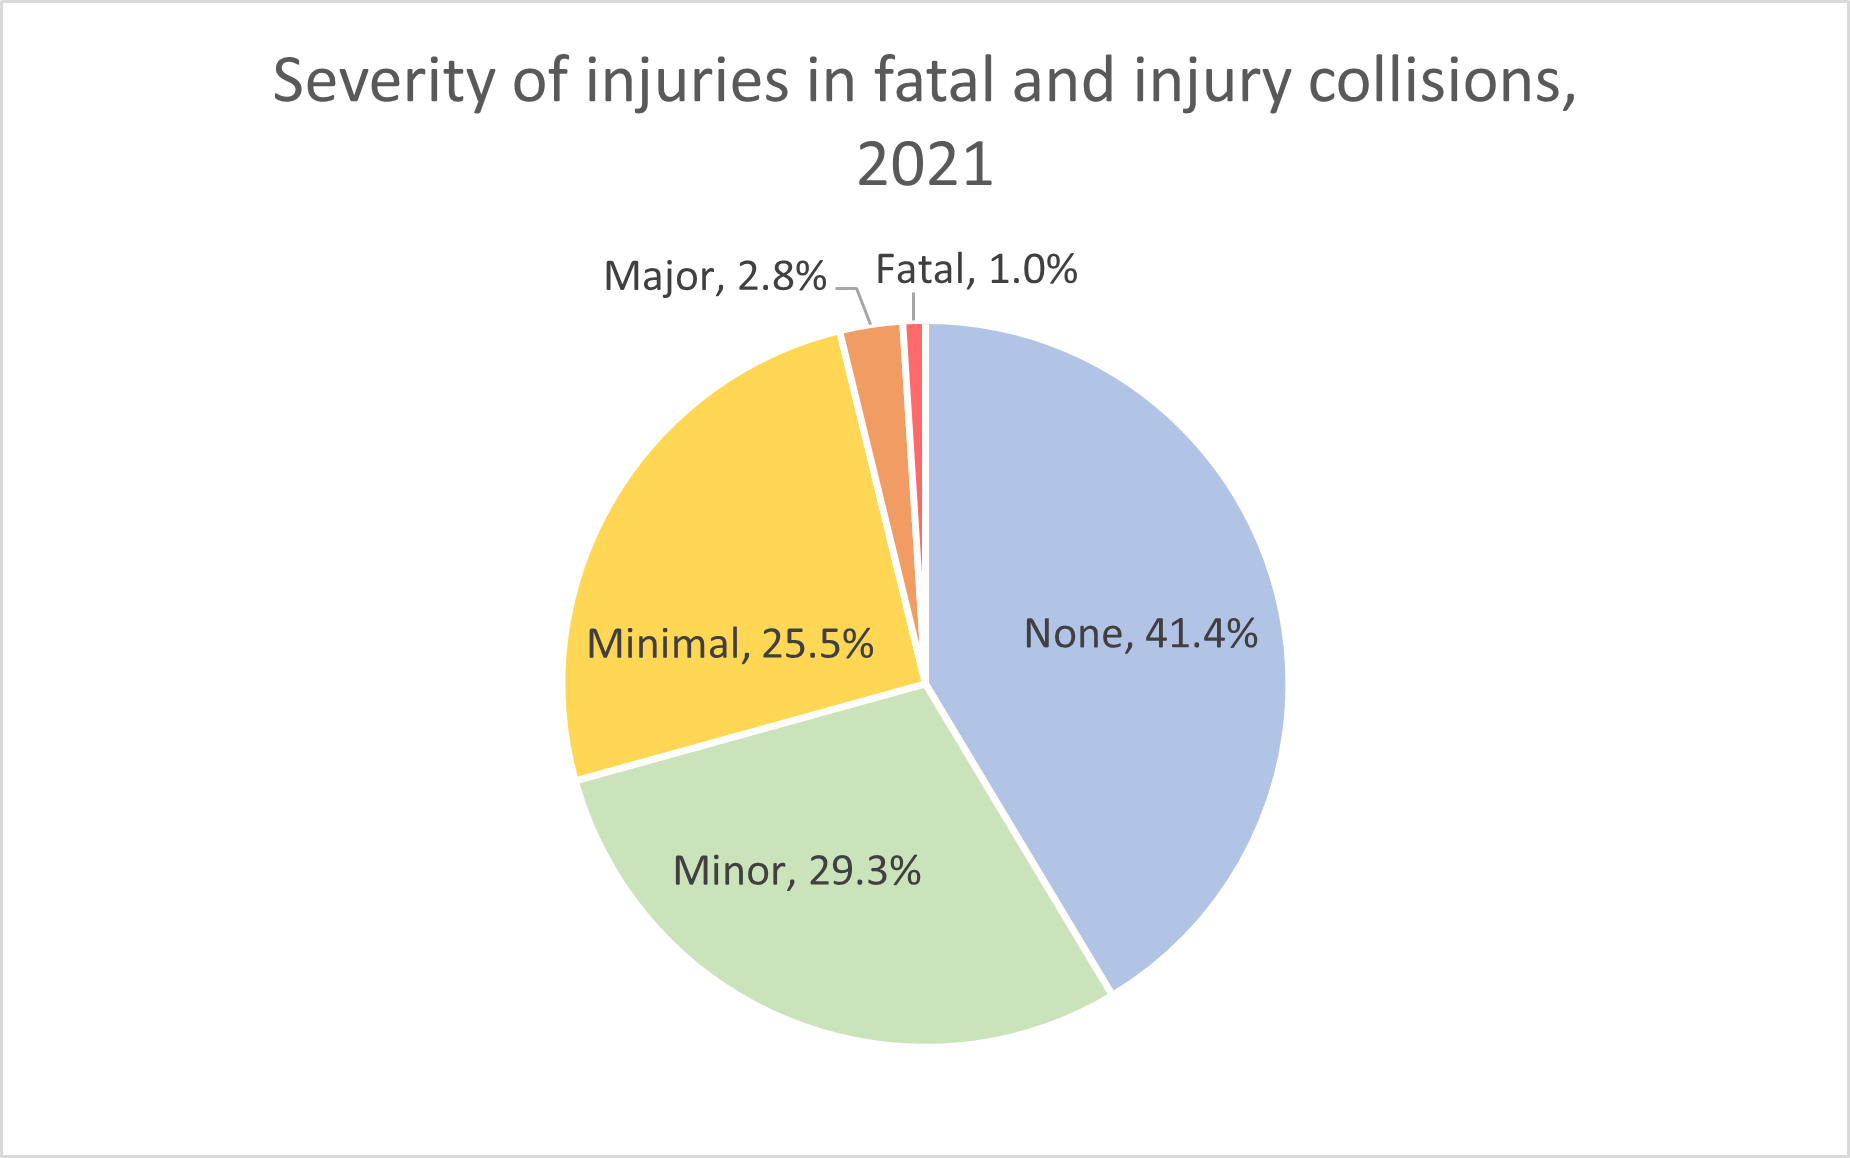
- Even in fatal and injury collisions, most people involved in the collisions are not injured severely enough to require hospitalization. In the following chart for 2021, a person with “minimal” injuries did not go to the hospital, a person with “minor” injuries was treated in the emergency room and then released, a person with “major” injuries was admitted to the hospital for treatment or observation, and a person with “fatal” injuries died at the accident scene or within 30 days of the collision. Note that 41.4% of persons who had been involved in injury or fatal collisions were uninjured themselves. (Ontario Ministry of Transportation, 2024a)
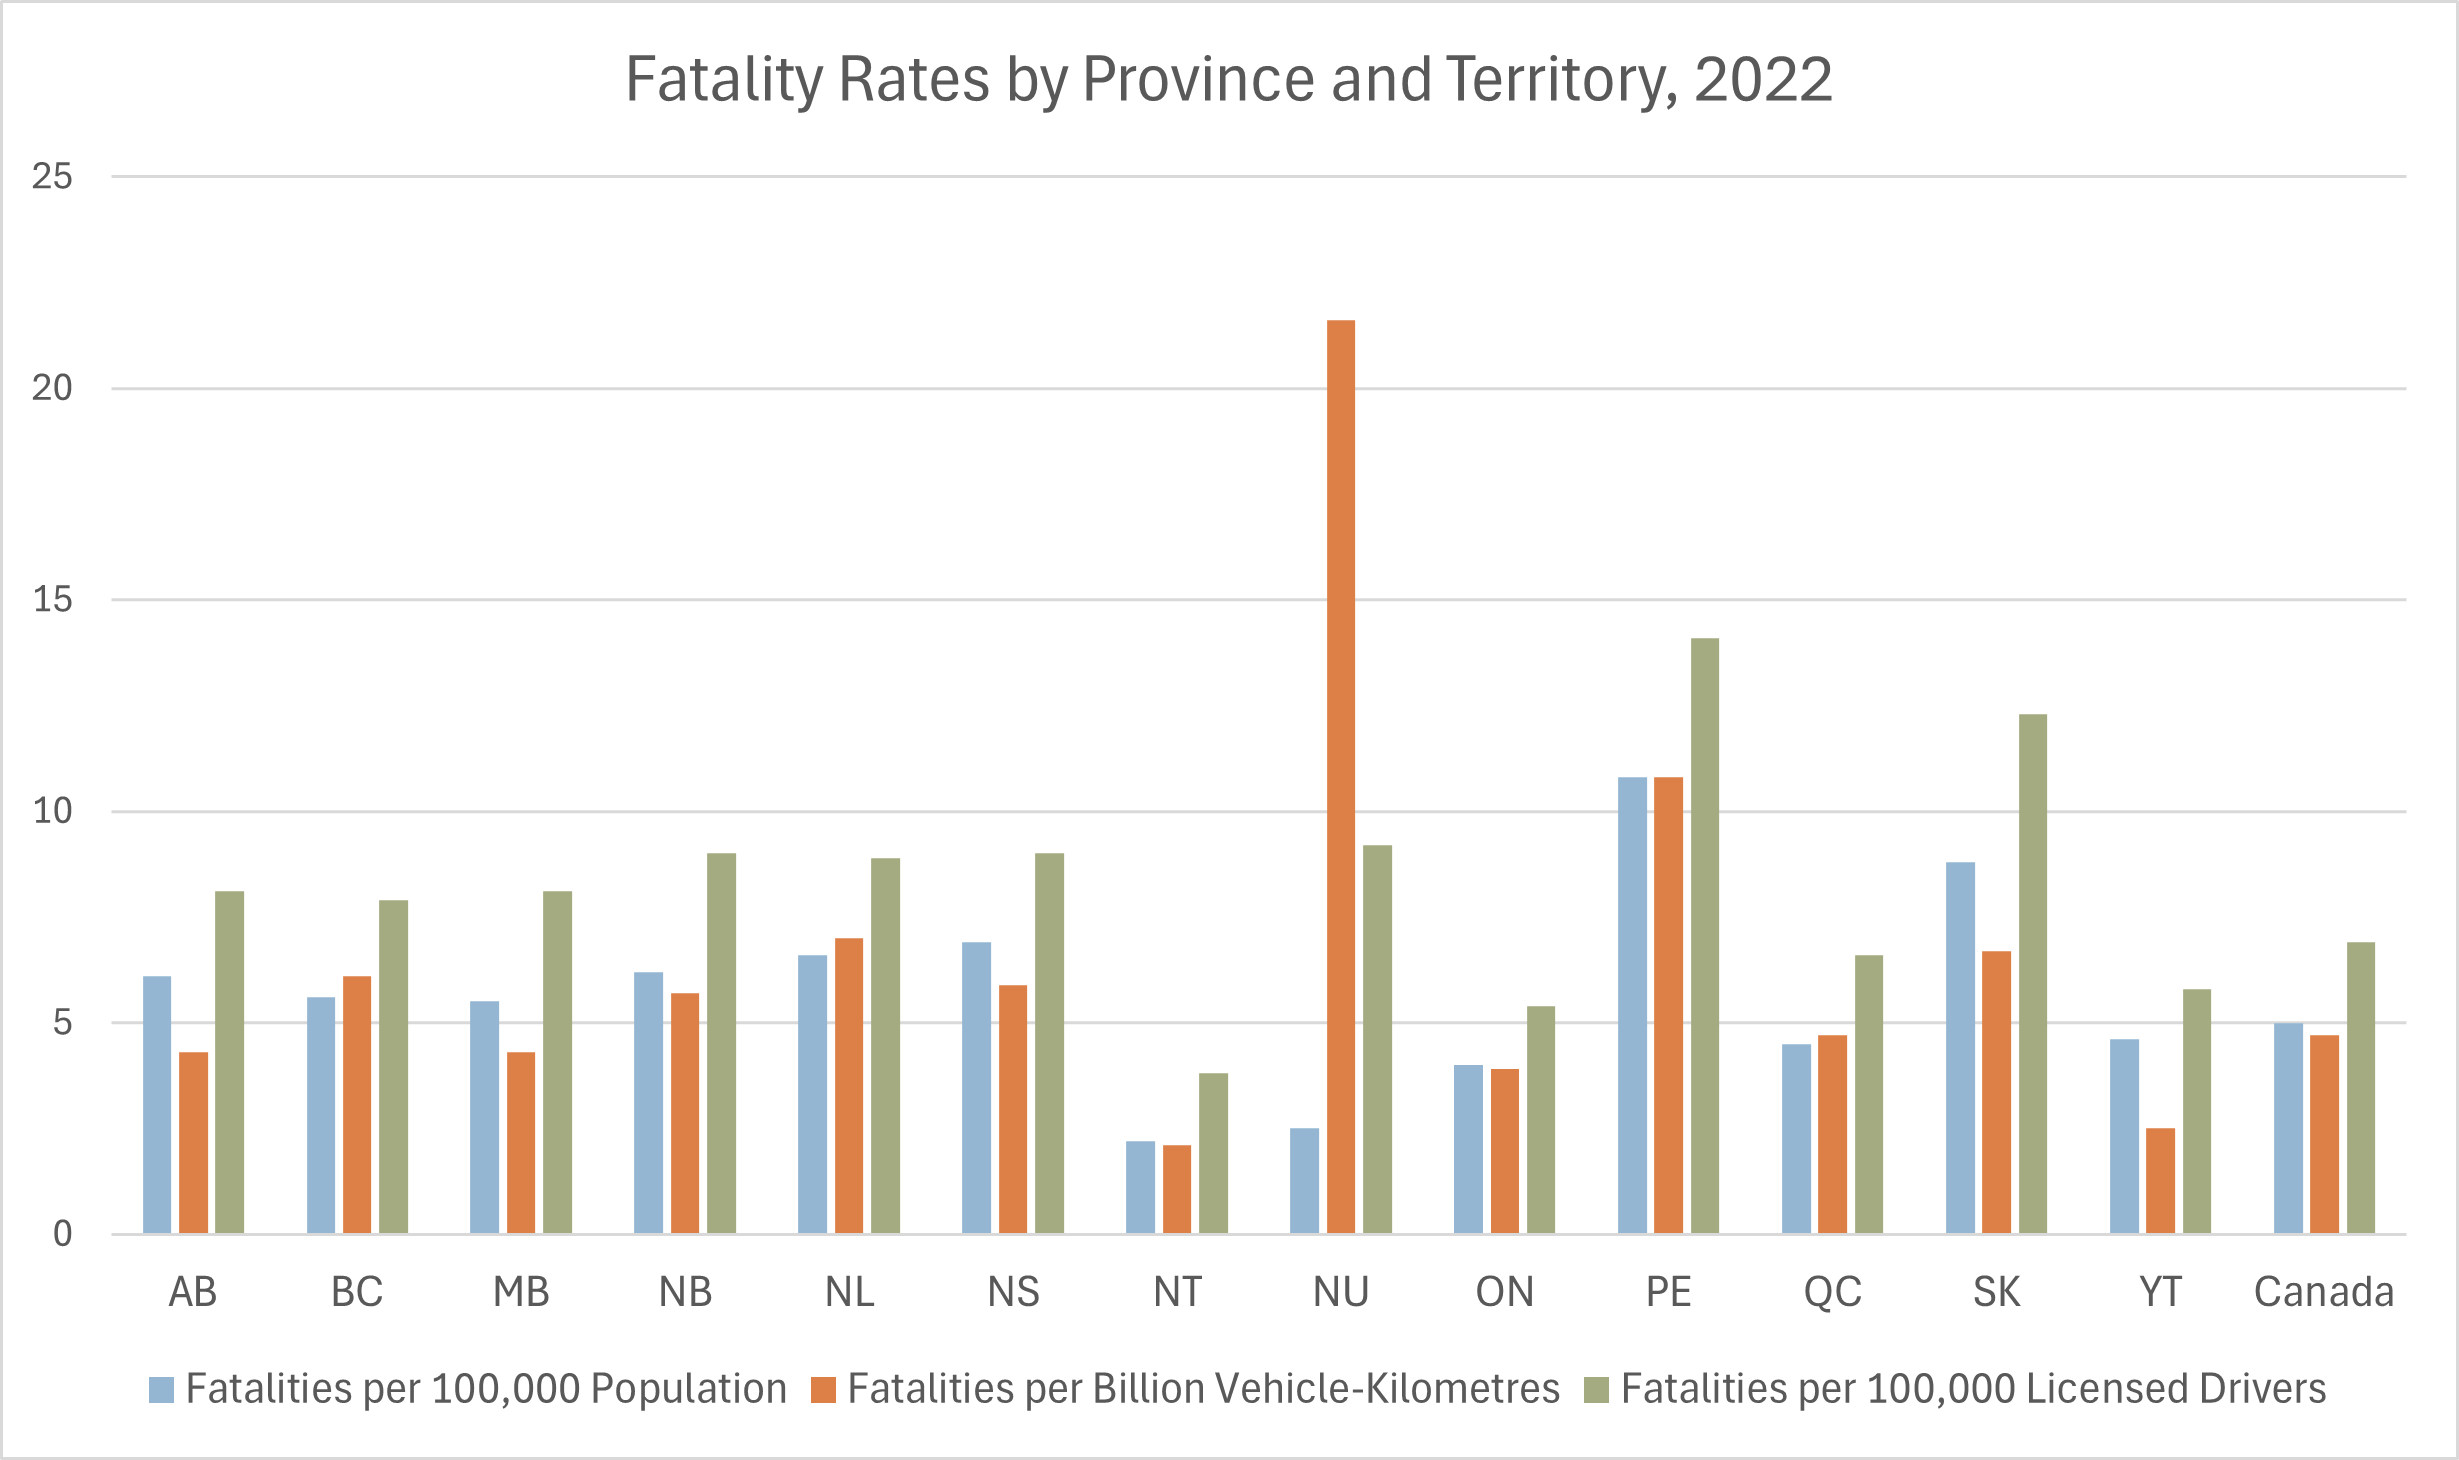
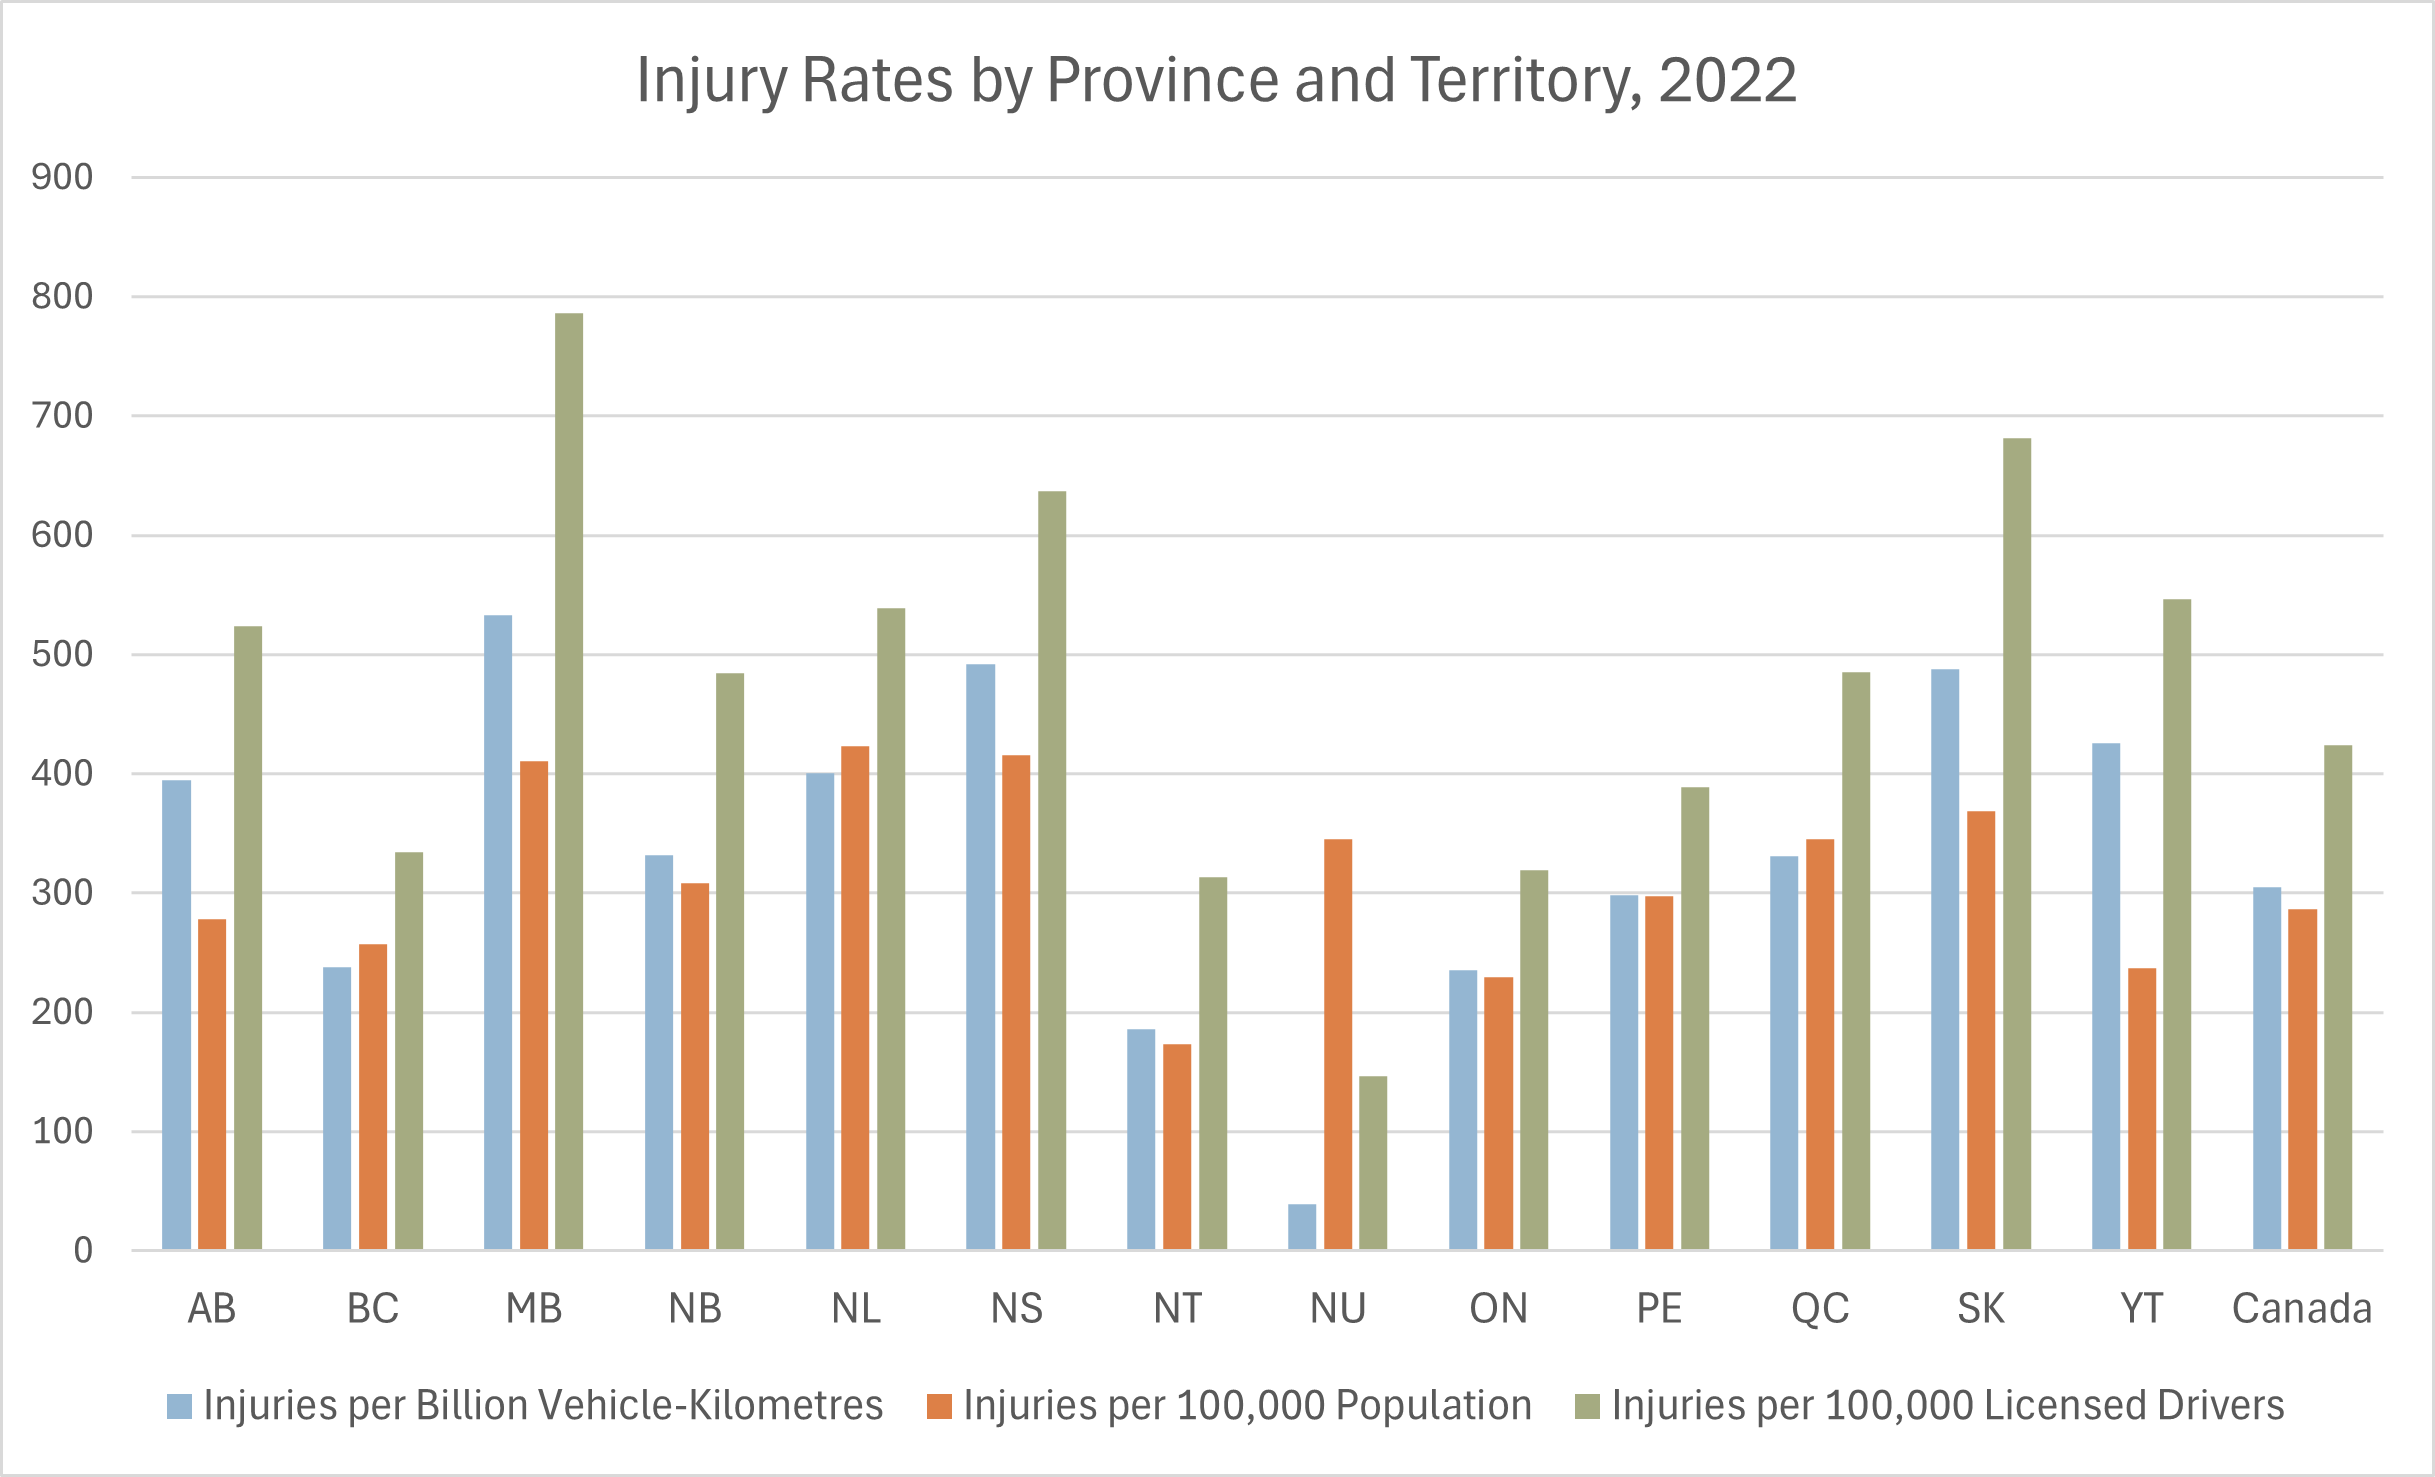
- In 2022, by common measures of road fatality rates, Ontario had one of the lowest fatality rates of any province. Ontario’s road injury rates were also below the Canadian national rates. See the following two charts. (Transport Canada, December 2023)
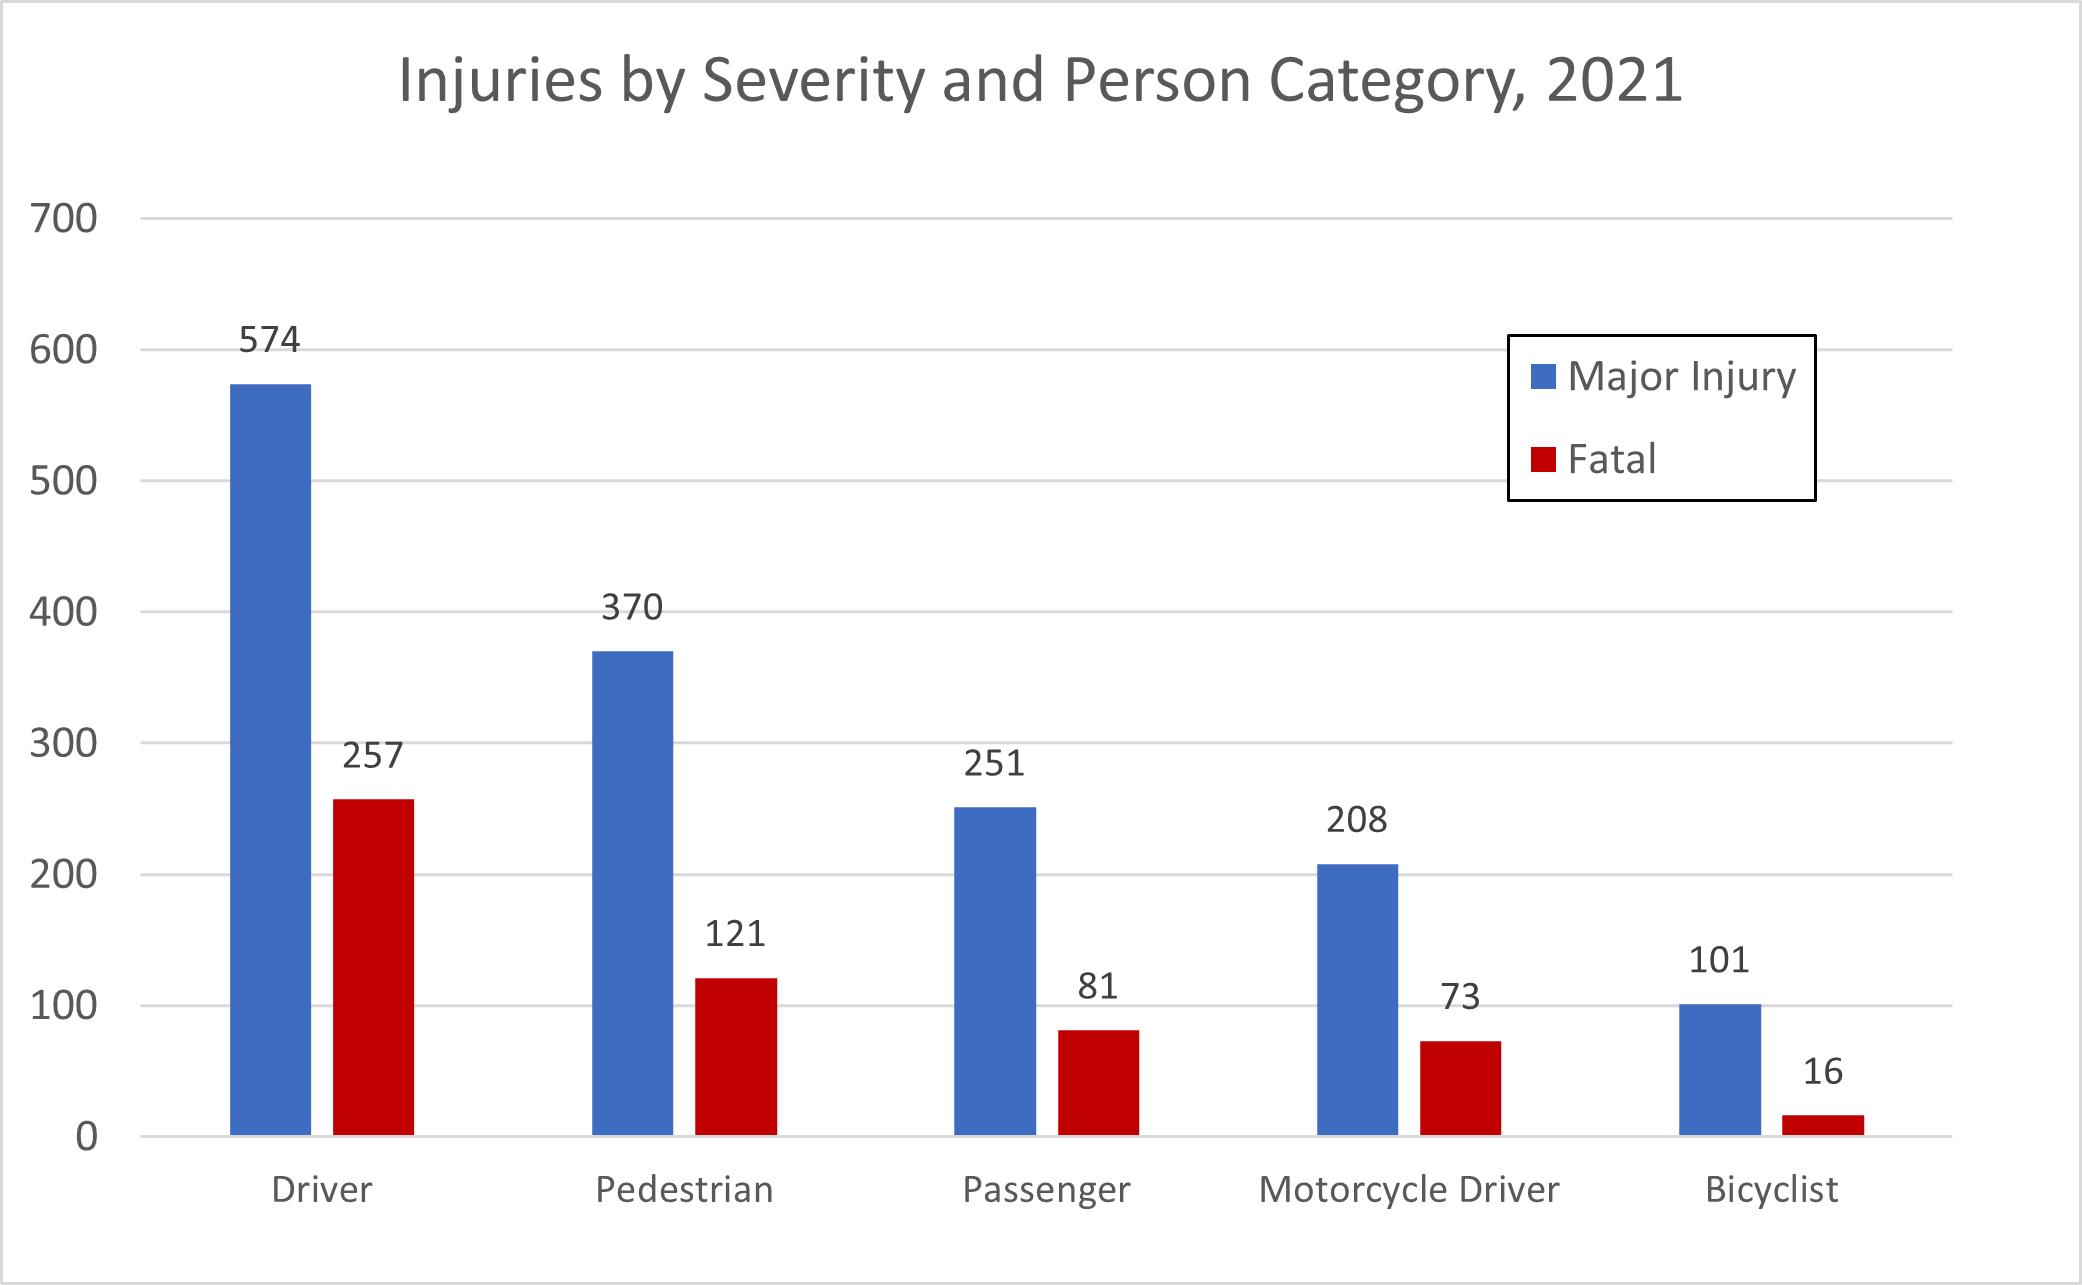
- The following chart shows Ontario’s most frequent categories of road users for major injuries and fatalities in road collisions in 2021. (“Major injuries” are injuries requiring hospitalization for treatment or observation.) Drivers of four-wheeled vehicles (cars, SUVs, trucks, and buses) suffered the most major injuries and fatalities. Even though motorcycles and mopeds represented just 2.5% of motor vehicles on Ontario’s roads, 36% as many motorcycle drivers as four-wheel drivers suffered major injuries, and 28% as many motorcycle drivers as four-wheel drivers were killed. Motorcycle drivers made up 13.4% of all persons suffering major injuries and 13.0% of all road fatalities. (Ontario Ministry of Transportation, 2024a)
- In 2021, there were 0.38 collision fatalities per 100 million vehicle-kilometres travelled in Ontario. Ontario’s collision fatality rate of 0.54 fatalities per 10,000 licensed drivers was the second lowest in North America. For more than 20 years, Ontario has ranked in the top five for road safety among all North American jurisdictions. (Ontario Ministry of Transportation, 2022)
- In 2021, there were 561 persons killed in collisions on Ontario’s roads. These fatalities included 257 drivers (not counting drivers of all-terrain vehicles or snowmobiles), 81 passengers (not counting motorcycle passengers), and 121 pedestrians. (Ontario Ministry of Transportation, 2024a)
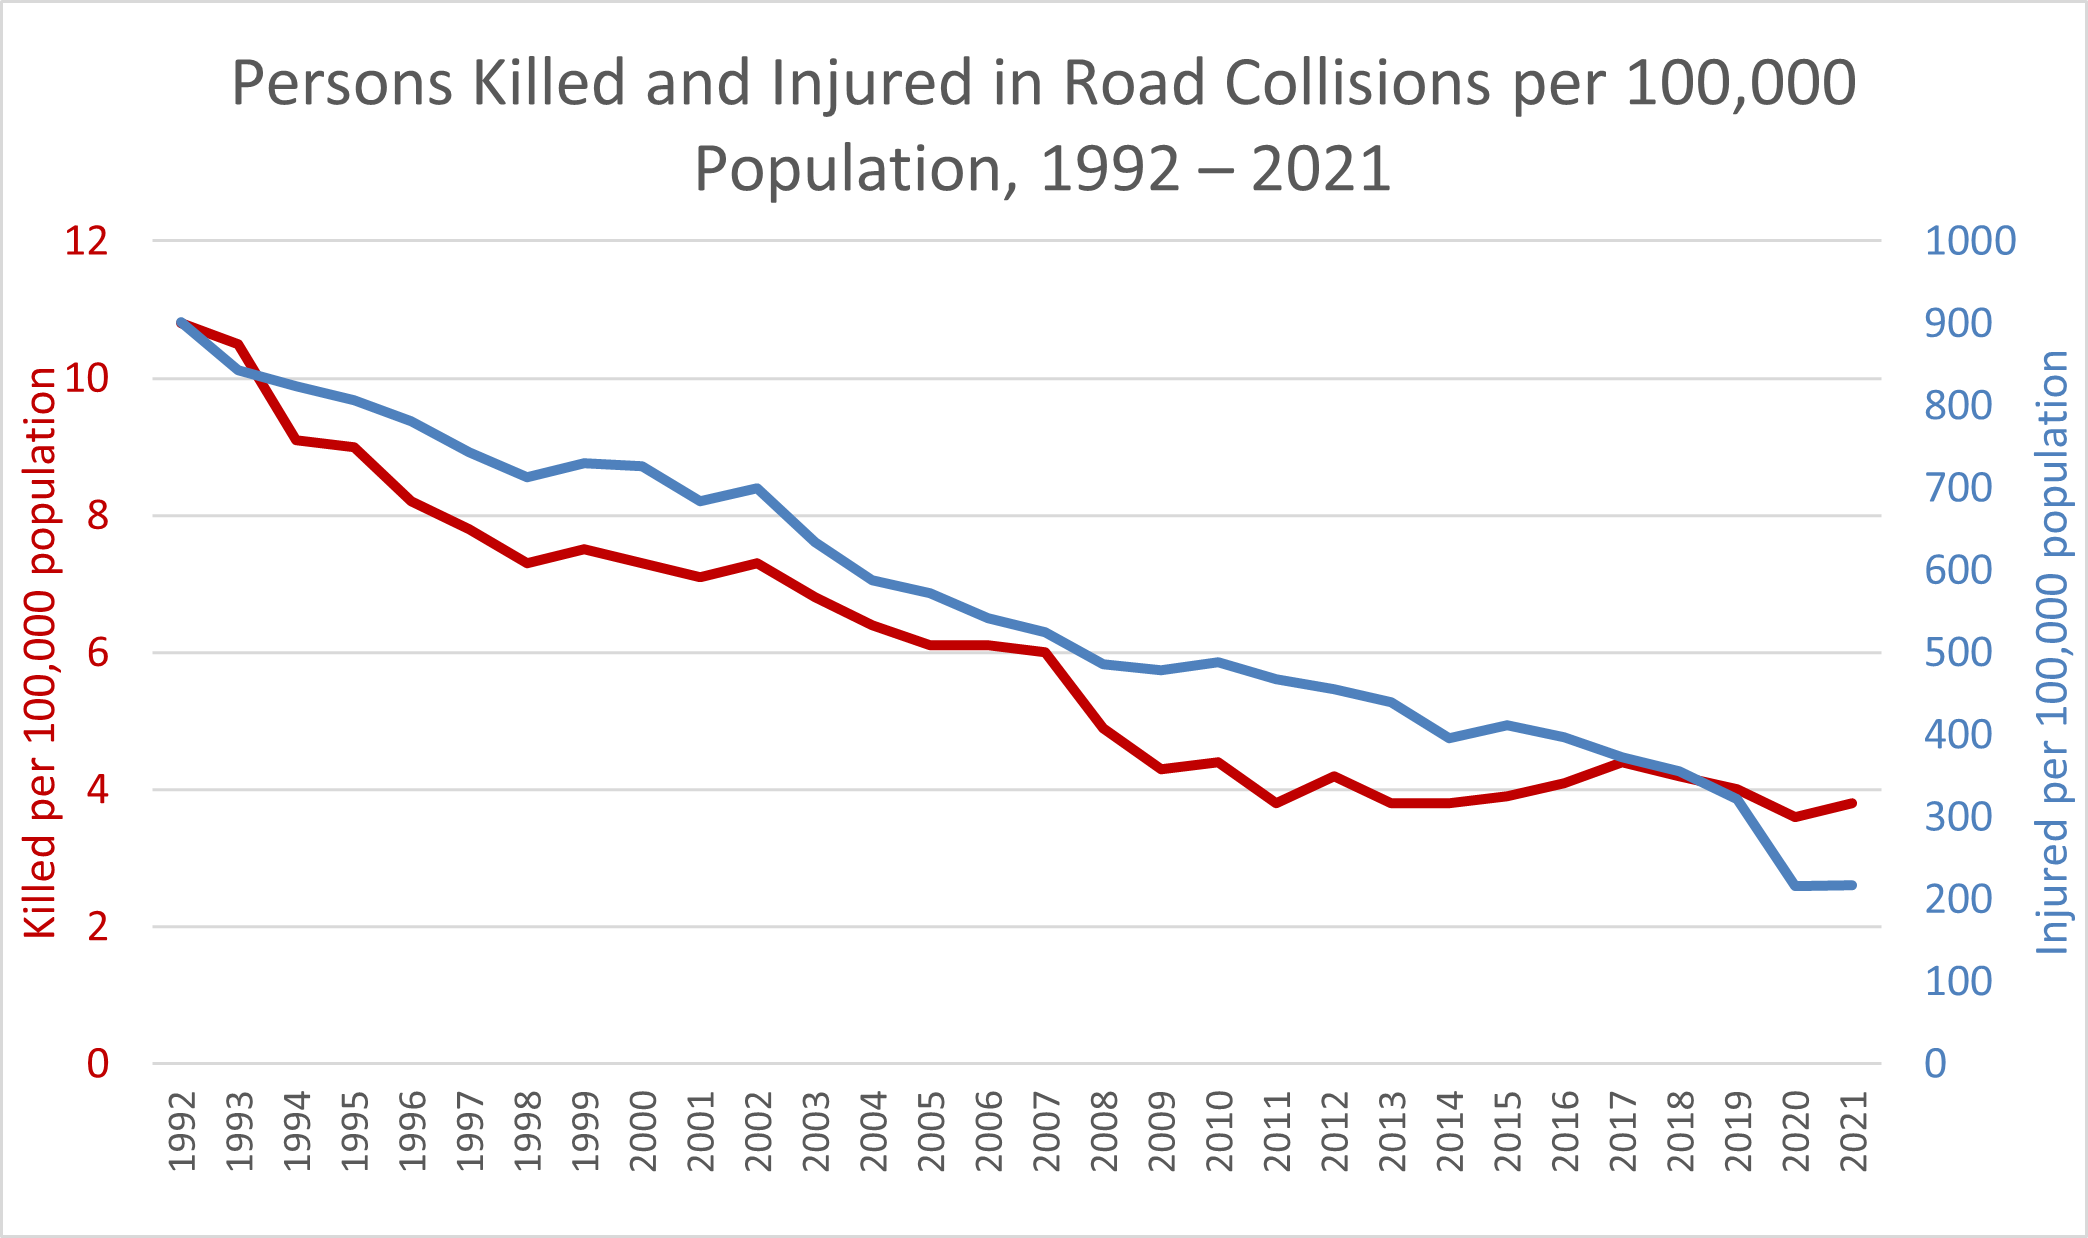
- In Ontario, the rates of persons killed in collisions per 100,000 population and injured in collisions per 100,000 population have fallen dramatically in recent decades. From 1992 to 2019 (before the COVID-19 pandemic), fatalities per 100,000 population fell by 63.0% from 10.8 to 4.0, and injured persons per 100,000 population declined by 64.4% from 901.4 to 321.3.
From 2019 to 2021, the injury rate fell more sharply than expected as people drove less during the pandemic. In 2019–2021, fatalities per 100,000 population fell by 5.0% from 4.0 to 3.8, and injured persons per 100,000 population declined by 32.3% from 321.3 to 217.6. As a result, for the entire period 2012 to 2021, fatalities per 100,000 population fell by 64.8% from 10.8 to 3.8, and injured persons per 100,000 population declined by 75.9% from 901.4 to 217.6. See the following chart. (Ontario Ministry of Transportation, 2024a)
- In 2021 in Ontario, there were approximately 1,000 road collisions and 3.6 road fatalities per billion vehicle-kilometres travelled. (Ontario Ministry of Transportation, 2024a)
- In 2021 in Ontario, there were 5.2 fatalities per 100,000 licensed drivers, the lowest such fatality rate in North America. However, this rate was higher than the rate of 5.0 per 100,000 licensed drivers in 2020 as Ontario began to recover from the worst effects of the COVID-19 pandemic. (Ontario Ministry of Transportation, 2024a)
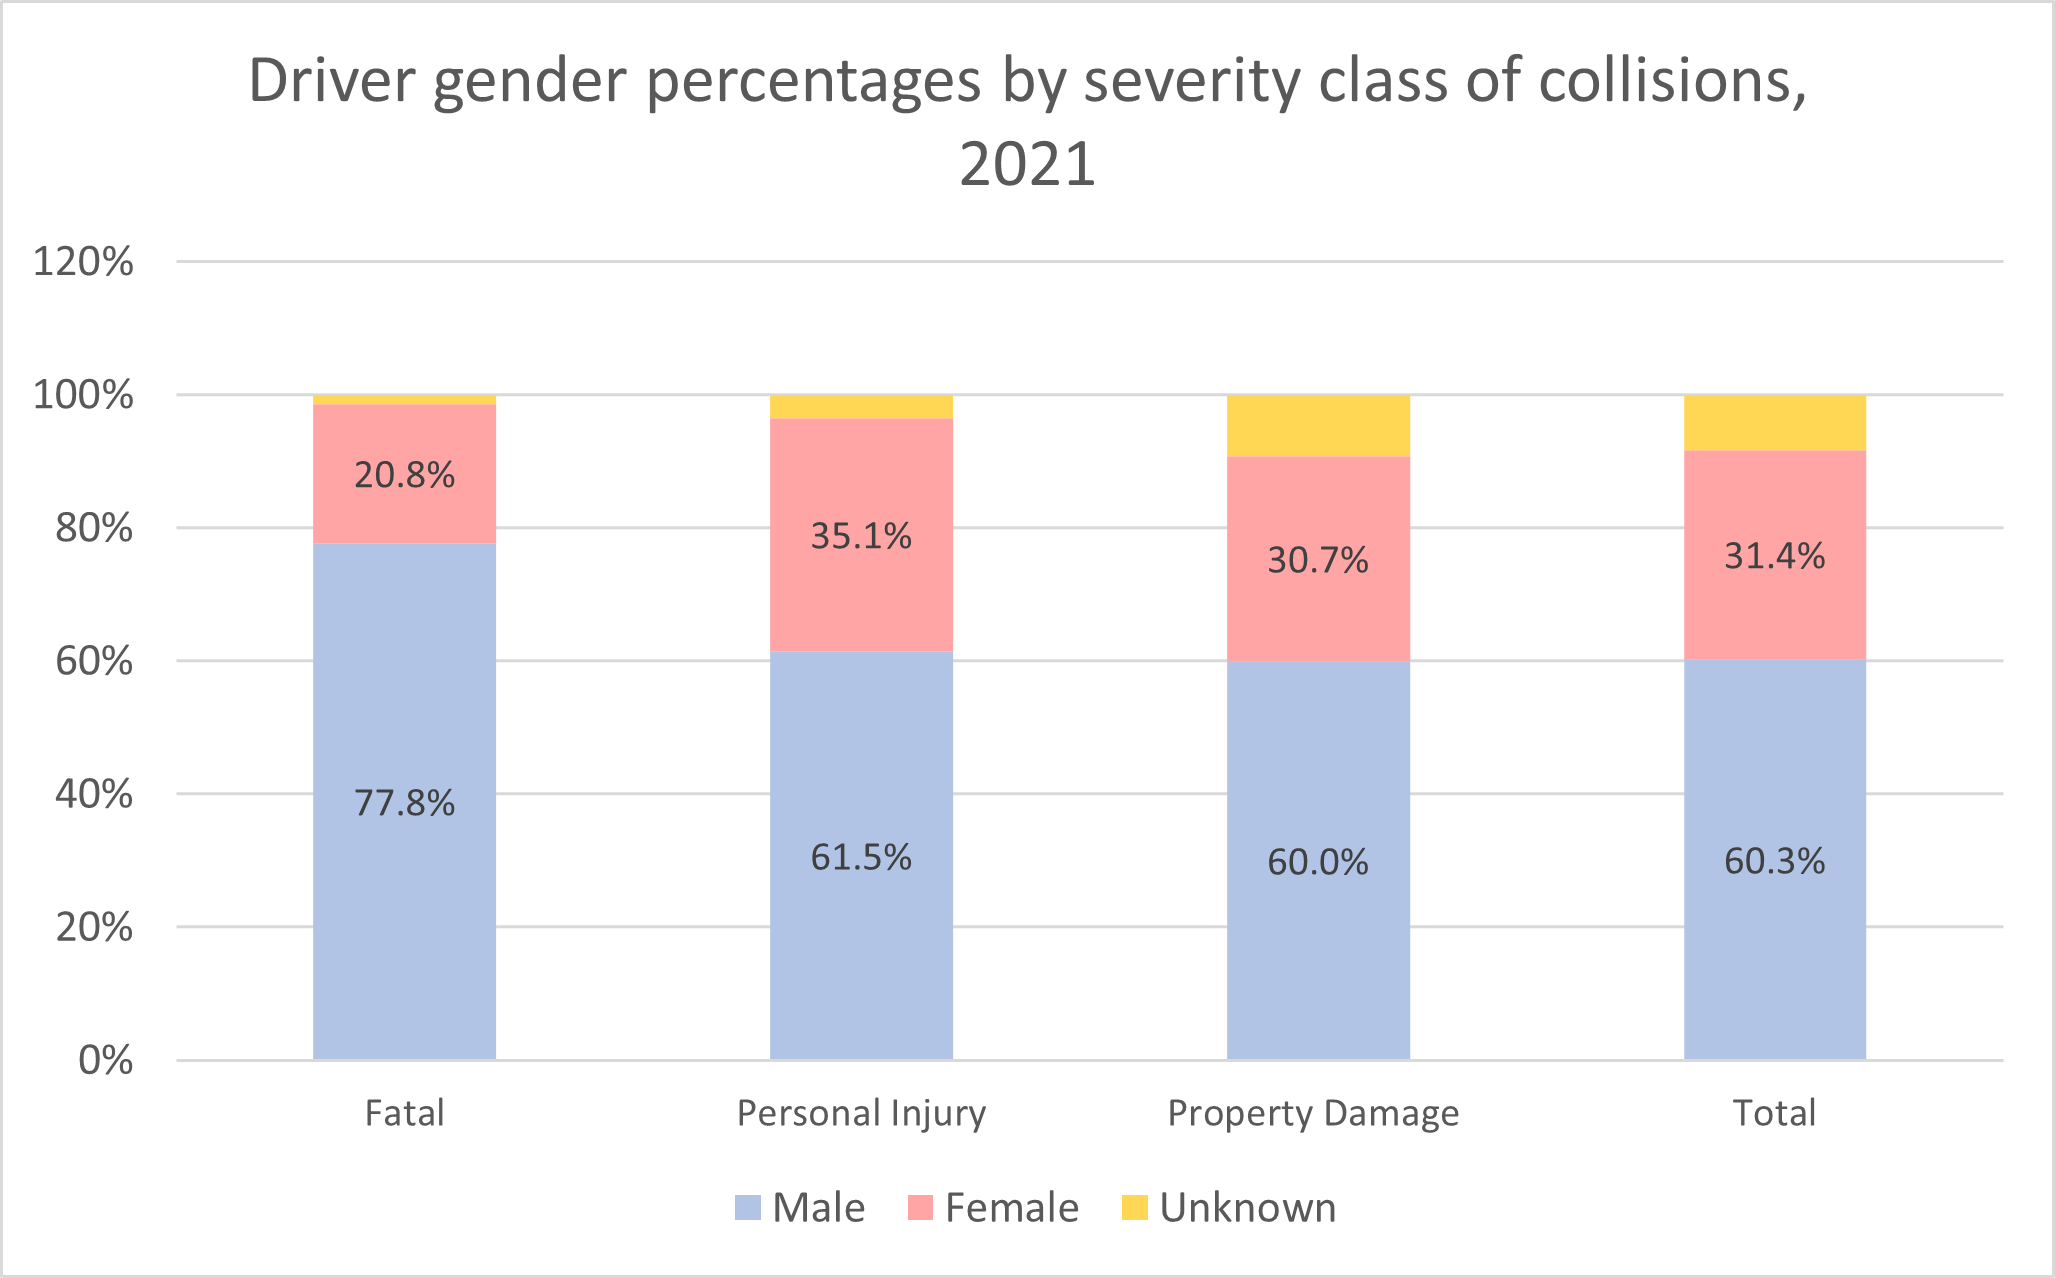
- The following chart shows the percentages of male and female drivers involved in collisions of three severity classes in 2021: fatal, injury and property damage only. Male drivers made up 60.0% of drivers in property damage crashes, 61.5% of drivers involved in injury crashes, and 77.8% of drivers involved in fatal crashes. (Ontario Ministry of Transportation, 2024a)
- In 2021, there were 153,751 reportable road collisions in Ontario, 519 of which were fatal. This figure represented a 4.8% decline from the pre-pandemic year 2019, when there were 545 fatal collisions. It also represented a 44.9% decline from 1992, when there were 942 fatal collisions. (Ontario Ministry of Transportation, 2024a)
- The 519 fatal collisions in 2021 involved 486 passenger cars, 119 pickup trucks, 106 trucks, and 81 motorcycles and mopeds, among other types of vehicles. (Ontario Ministry of Transportation, 2024a)
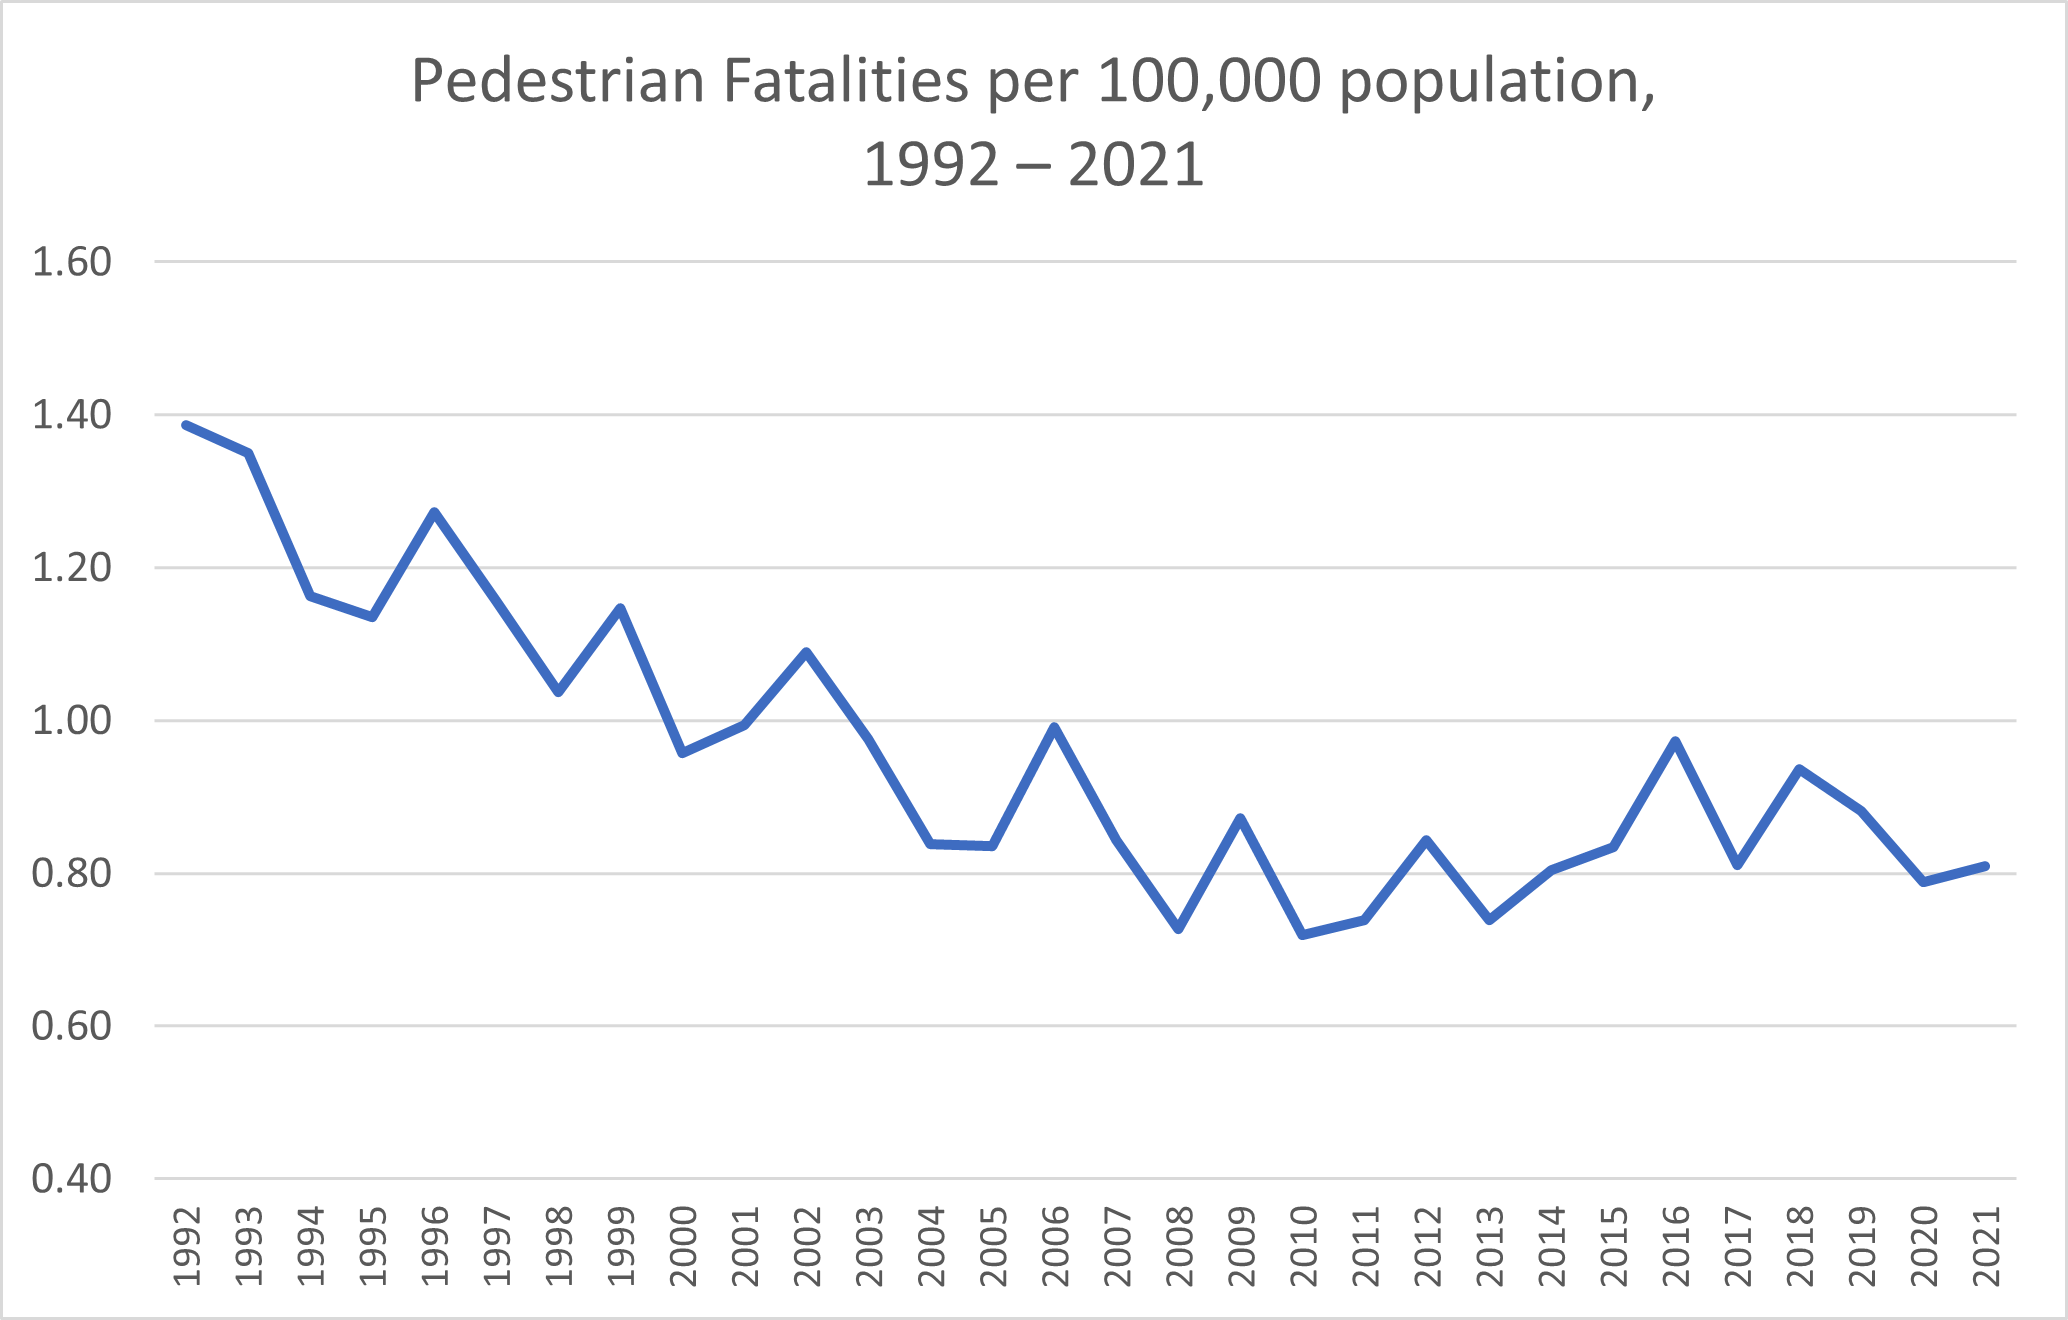
- In 2021, 121 pedestrians were killed in road accidents, 19 fewer than in 1992. From 1992 to 2008, the rate of pedestrian fatalities per 100,000 population declined by 48%, from 1.39 in 1992 to 0.73 in 2008. There followed a slight uptick starting in 2009, from 0.87 per 100,000 population in 2009 to 0.97 per 100,000 population in 2016. Still, the rate in 2016 was 30% below the rate in 1992. See the following chart. (Ontario Ministry of Transportation, 2024a)
- In 2021, 76 motorcyclists (including drivers and passengers) were killed in collisions in Ontario, up from 55 in 2012. The following table lists some factors relevant to fatal motorcycle collisions in 2021 and the percentages of fatal motorcycle crashes to which the factors apply. These factors are not mutually exclusive; more than one factor may apply to a given crash. “Had been drinking” means that the person had consumed alcohol but was not demonstrably impaired at the time of the crash. (Ontario Ministry of Transportation, 2024a)
|
Factors (not mutually exclusive) |
Percentage |
|
Unlicensed motorcycle drivers |
10.5 |
|
Under 25 years old |
12.7 |
|
Ability impaired: BAC > 0.08% |
14.7 |
|
Had been drinking |
4.0 |
|
Helmet not worn |
5.2 |
|
Speed too fast/lost control |
50.6 |
|
Other motorcycle driver error |
20.3 |
|
Single-vehicle collision |
36.4 |
|
Day |
66.0 |
|
Night |
29.0 |
|
Weekend |
44.2 |
- In 2021, passenger vehicles made up about 72.1% of all vehicles in Ontario and accounted for 72.9% of all vehicles involved in collisions. Motorcycles and mopeds made up just 2.2% of all vehicles in Ontario but accounted for 9.2% of all vehicles involved in fatal collisions. (Ontario Ministry of Transportation, 2024a)
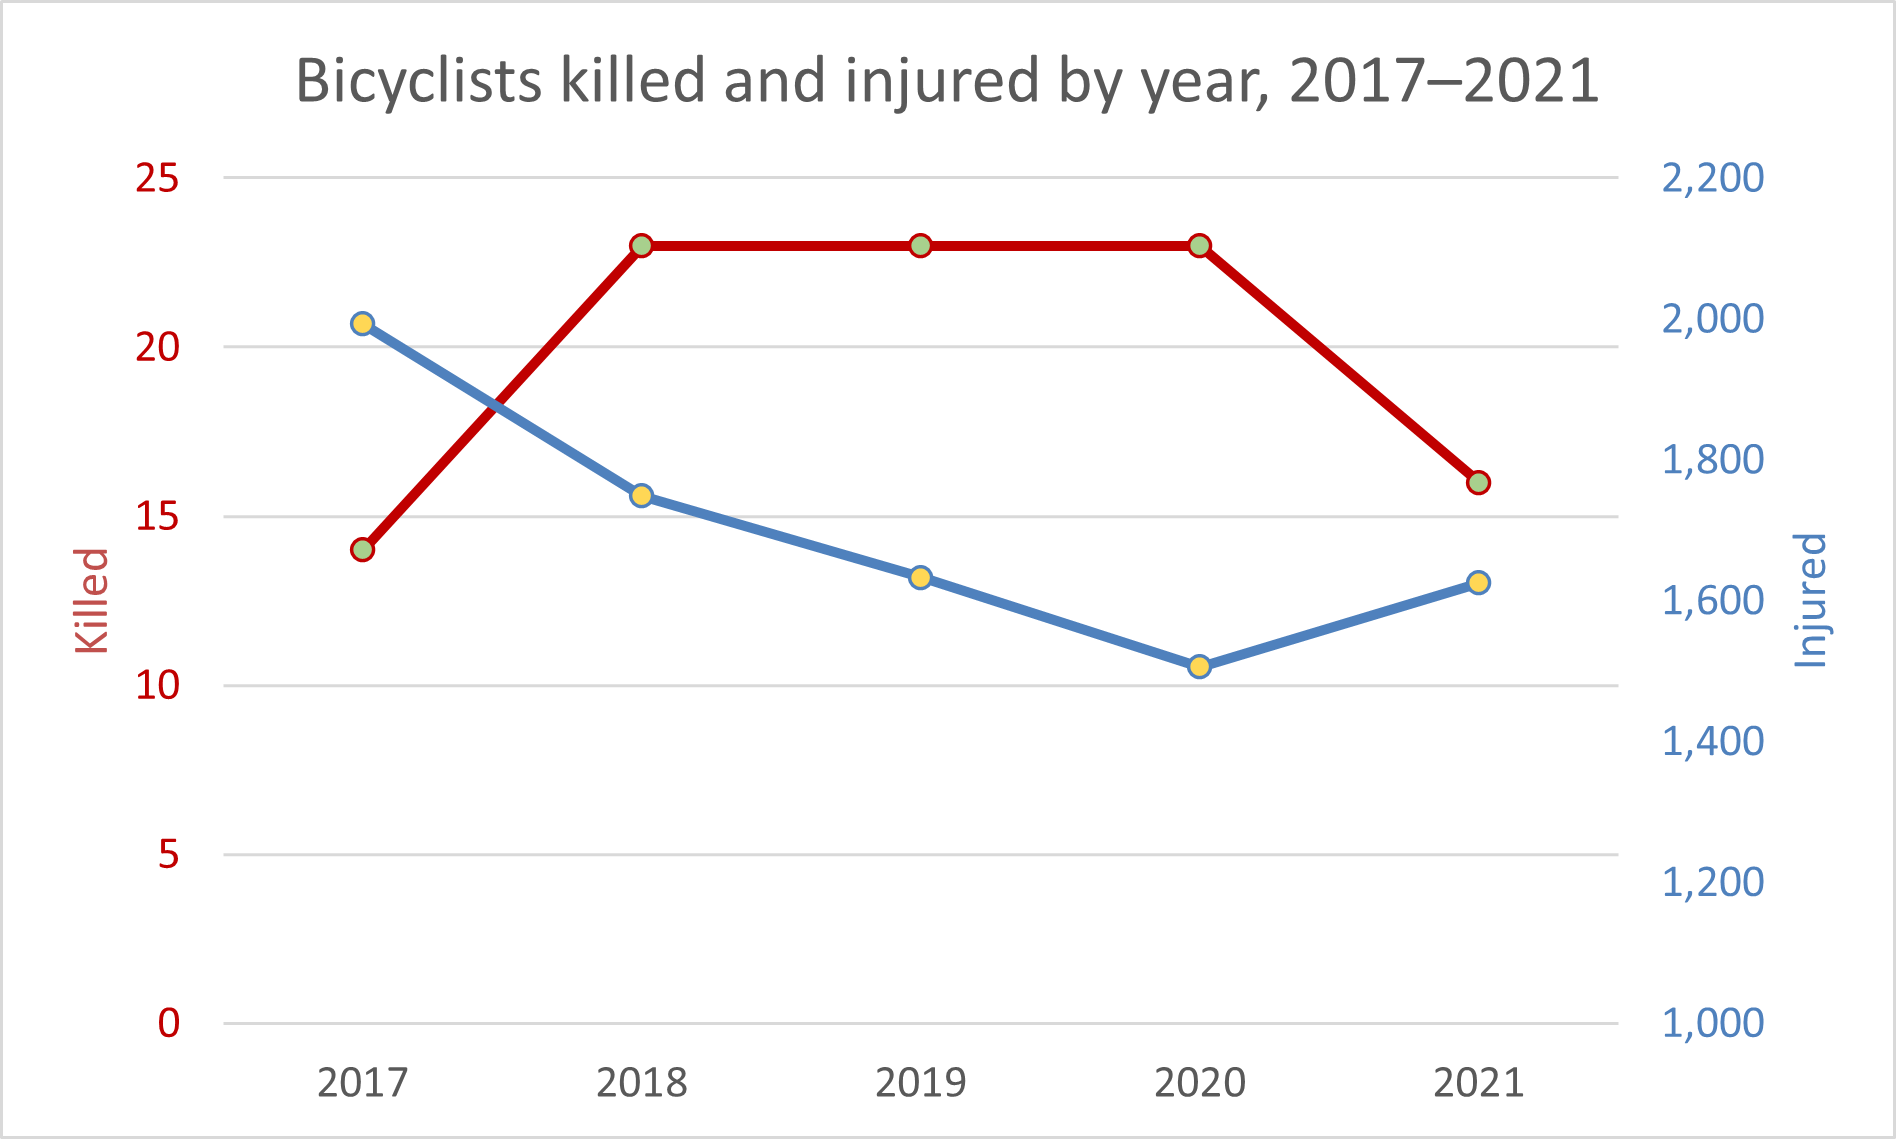
- The following chart shows the numbers of bicyclists (including operators and passengers) killed and injured in 2017–2021. Due to the small size of the dataset of fatally injured bicyclists, no significant trend was identified. With the null hypothesis of no significant linear trend in bicyclists killed, the p-value for this regression would be 0.824, meaning a high probability that values may fall far outside the trend line due to random chance.
There was a significant downtrend in bicyclists injured (although 2021 saw an uptick as Ontario recovered from the worst of the COVID-19 pandemic). With the null hypothesis of no significant linear downtrend in bicyclists injured, the p-value for this regression would be 0.038, meaning that we can reject that hypothesis with 95% confidence. The slope of the linear trendline is −97.9, which represents an average of 97.9 fewer injured bicyclists with each passing year. (Ontario Ministry of Transportation, 2024a)
- Of the vehicles involved in collisions in Ontario in 2021, 92.3% were insured, 0.9% were not, and the rest were unknown. Of the vehicles involved in fatal collisions, 90.9% were insured, 4.3% were not, and the rest were unknown. (Ontario Ministry of Transportation, 2024a)
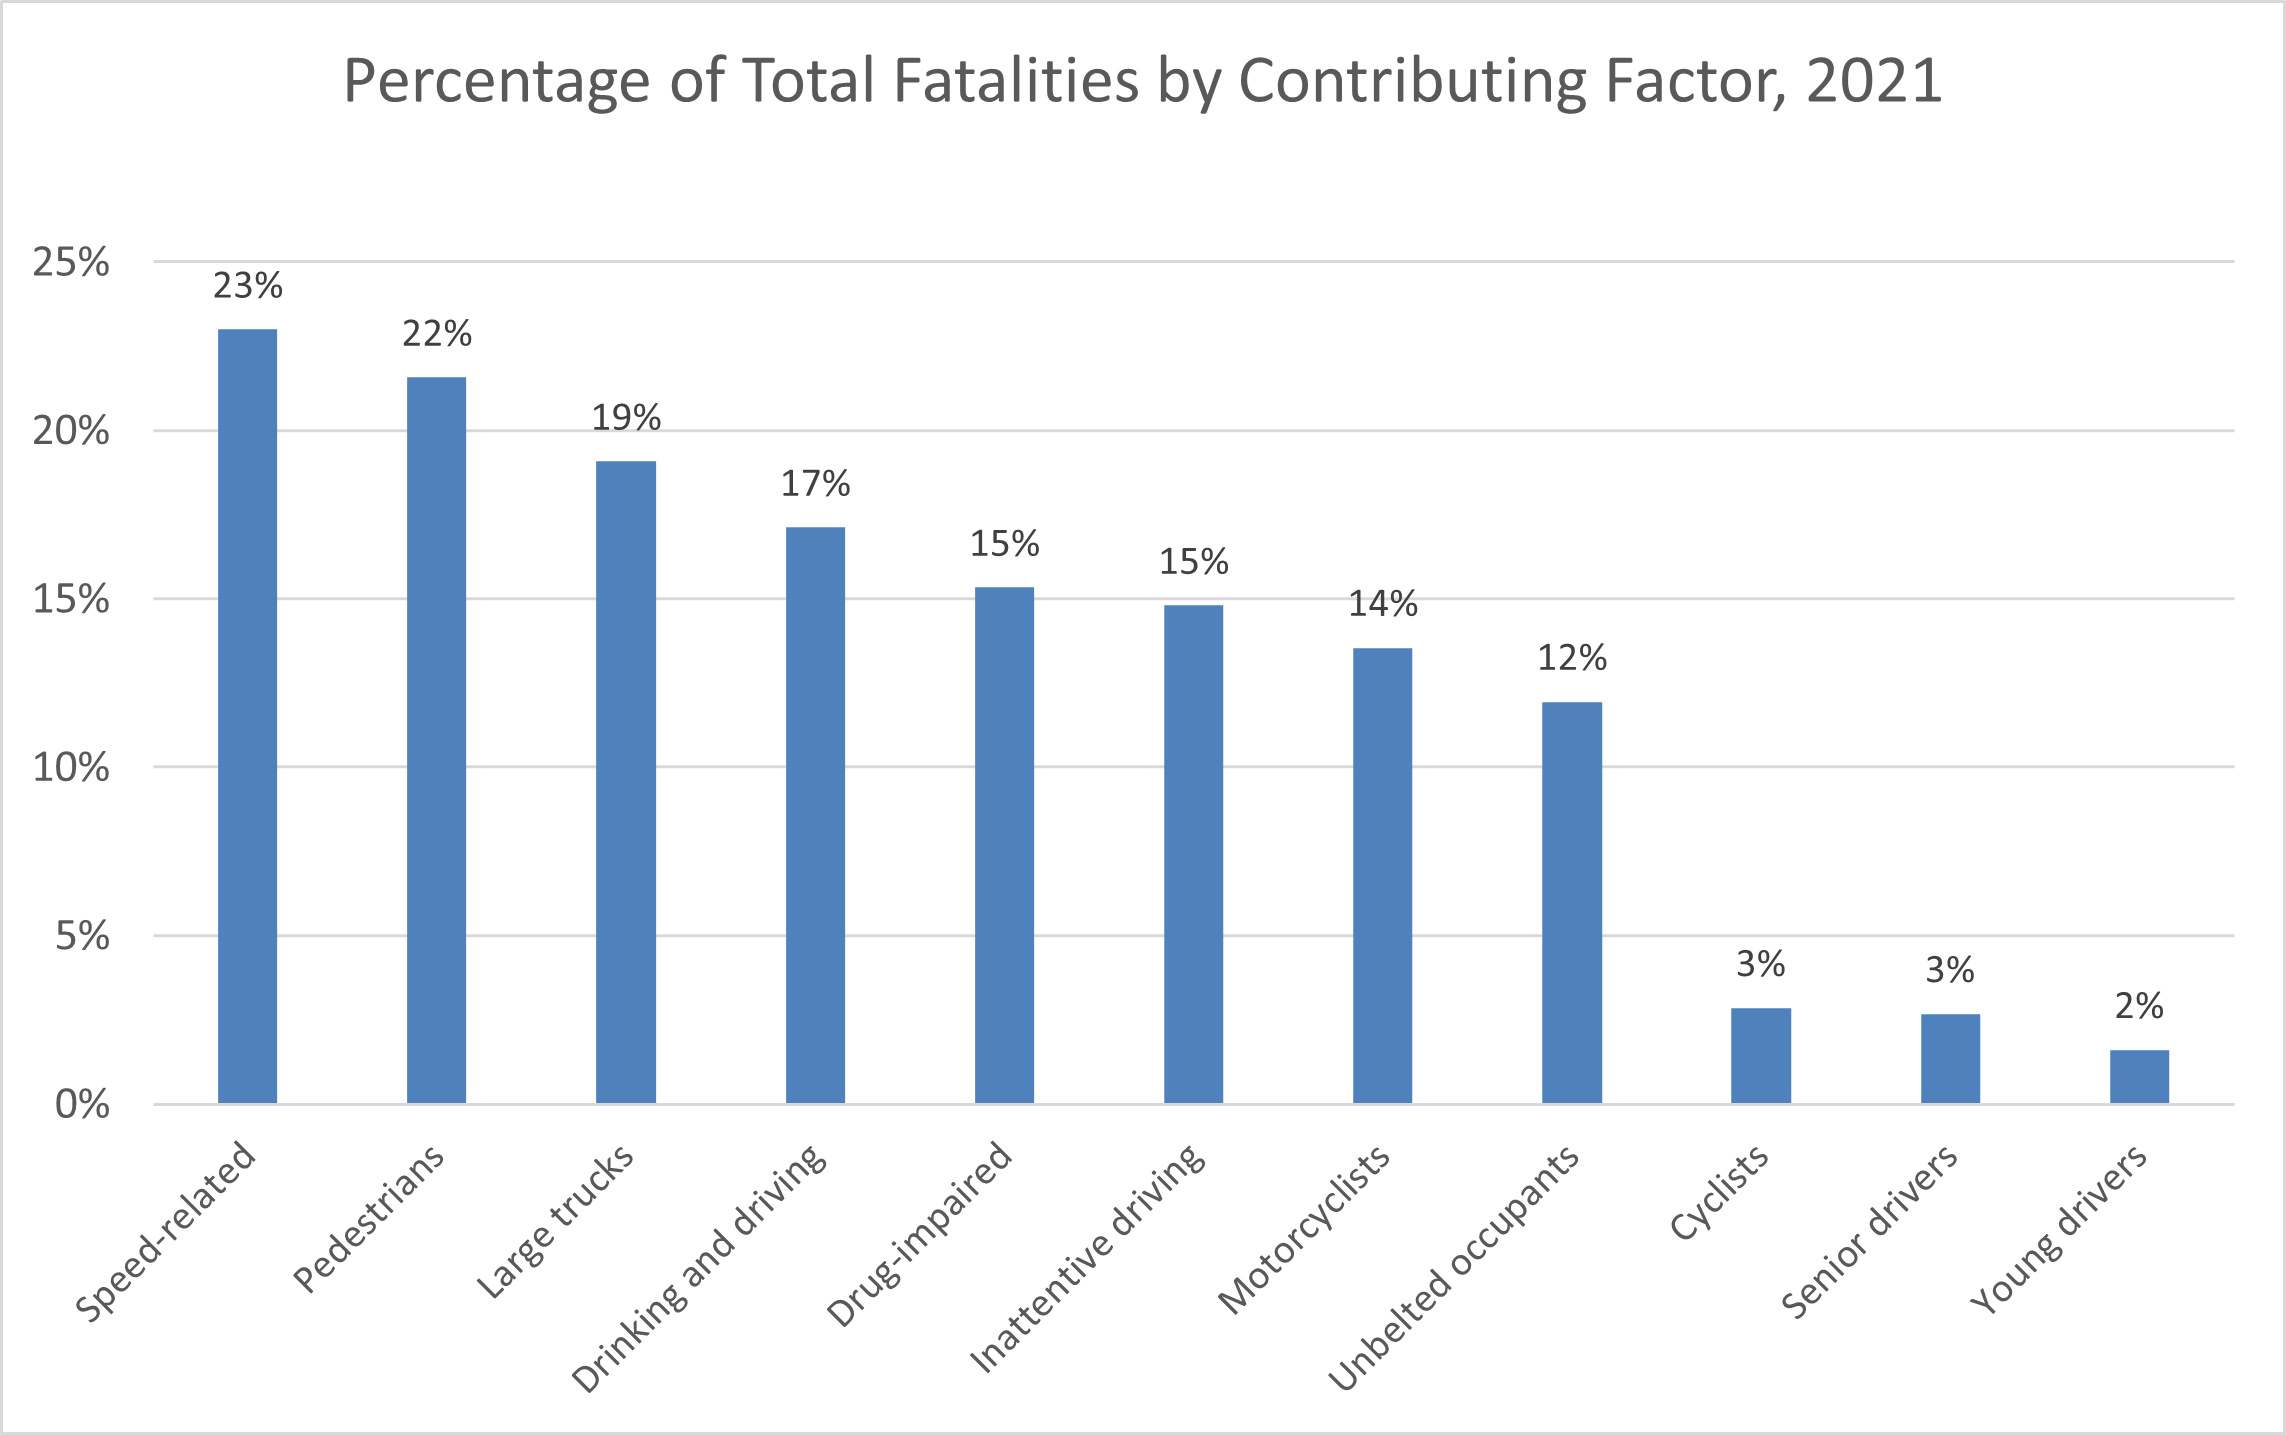
- In 2021, out of a total of 354 road fatalities, the contributing factors occurring most often were speed-related (129 fatalities), pedestrians (121 fatalities), large trucks (107 fatalities), and drinking and driving (96 fatalities). See the following table. Note that the fatalities don’t add up to 354 and the percentages don’t sum to 100% because many crashes involved more than one contributing factor. (Ontario Ministry of Transportation, 2024a)
|
Category |
Fatalities |
Percentage of total fatalities |
|
Speed-related |
129 |
23% |
|
Pedestrians |
121 |
22% |
|
Large trucks |
107 |
19% |
|
Drinking and driving |
96 |
17% |
|
Drug-impaired |
86 |
15% |
|
Inattentive driving |
83 |
15% |
|
Motorcyclists |
76 |
14% |
|
Unbelted occupants |
67 |
12% |
|
Cyclists |
16 |
3% |
|
Senior drivers |
15 |
3% |
|
Young drivers |
9 |
2% |
|
Total |
354 |
100% |
Also, see the following chart.
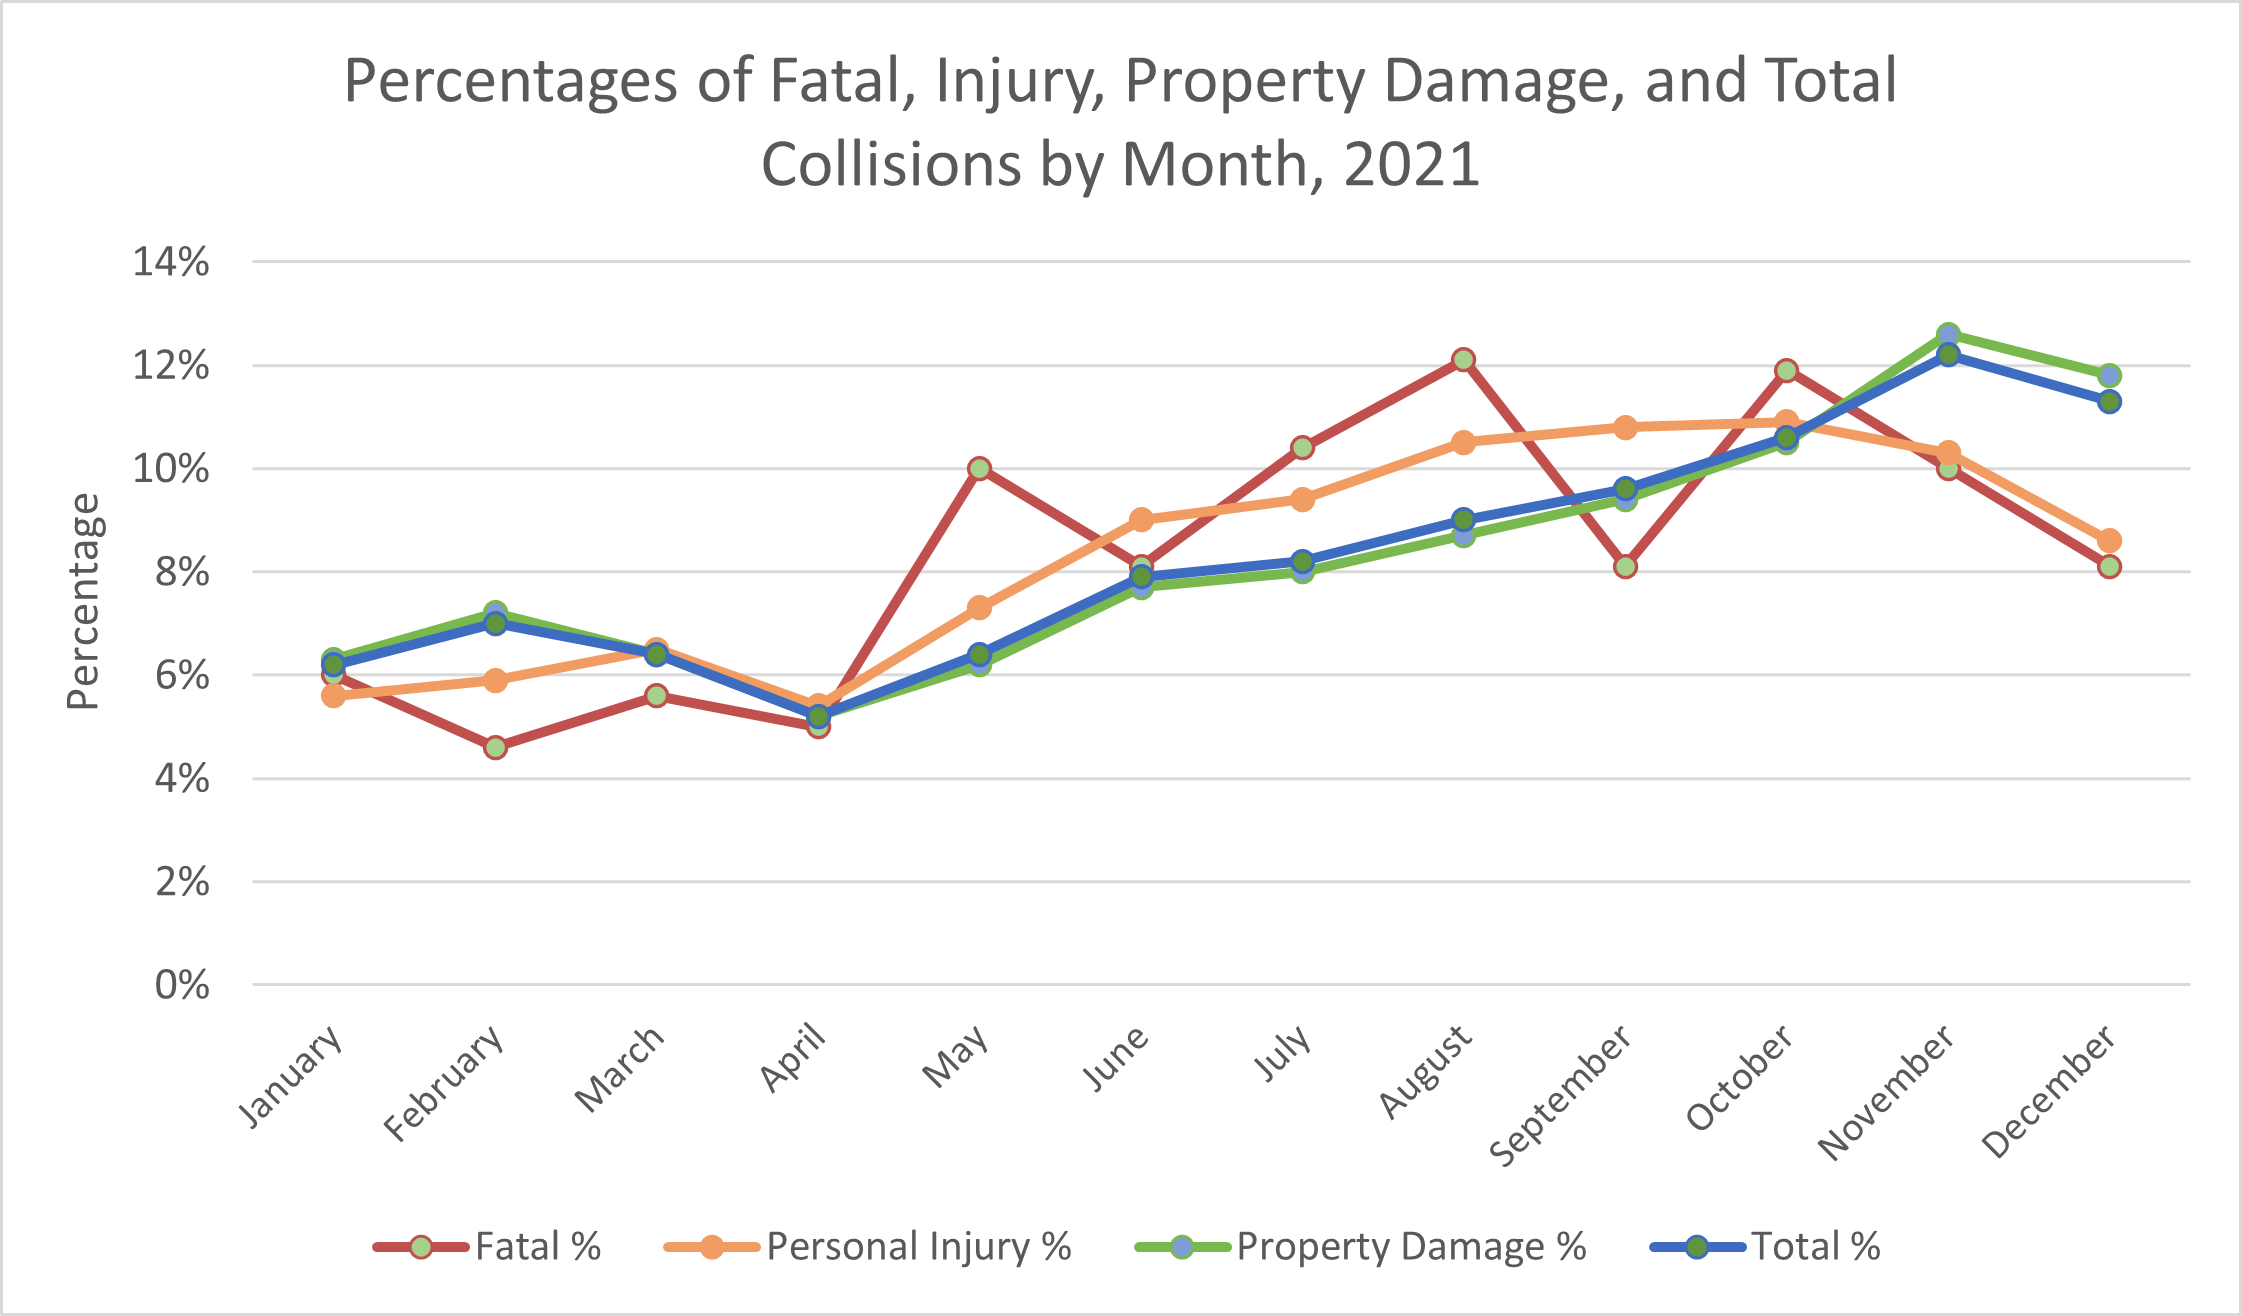
- In 2021, November was the month with the most collisions (12.2% of all crashes that year) and the most property damage-only crashes (12.6% of all property damage-only crashes). April was the month with the fewest collisions (5.2% of total collisions) and the fewest property damage-only collisions (5.2% of property damage-only collisions). Because the vast majority (84.1%) of collisions were property damage-only collisions, trends in total collisions and property damage-only collisions were strongly correlated (correlation coefficient = 0.995).
- August was the deadliest month for fatal collisions in 2021: 12.1% of fatal collisions that year occurred in August. However, 10.9% of personal injury crashes occurred in October, more than in any other month. Personal injury crashes were fairly well correlated with total crashes (correlation coefficient = 0.813). Fatal collisions were less well correlated with total crashes (correlation coefficient = 0.599). Fatal collisions were more strongly correlated with personal injury collisions (correlation coefficient = 0.833). All these trends are reflected in the following chart. (Ontario Ministry of Transportation, 2024a)
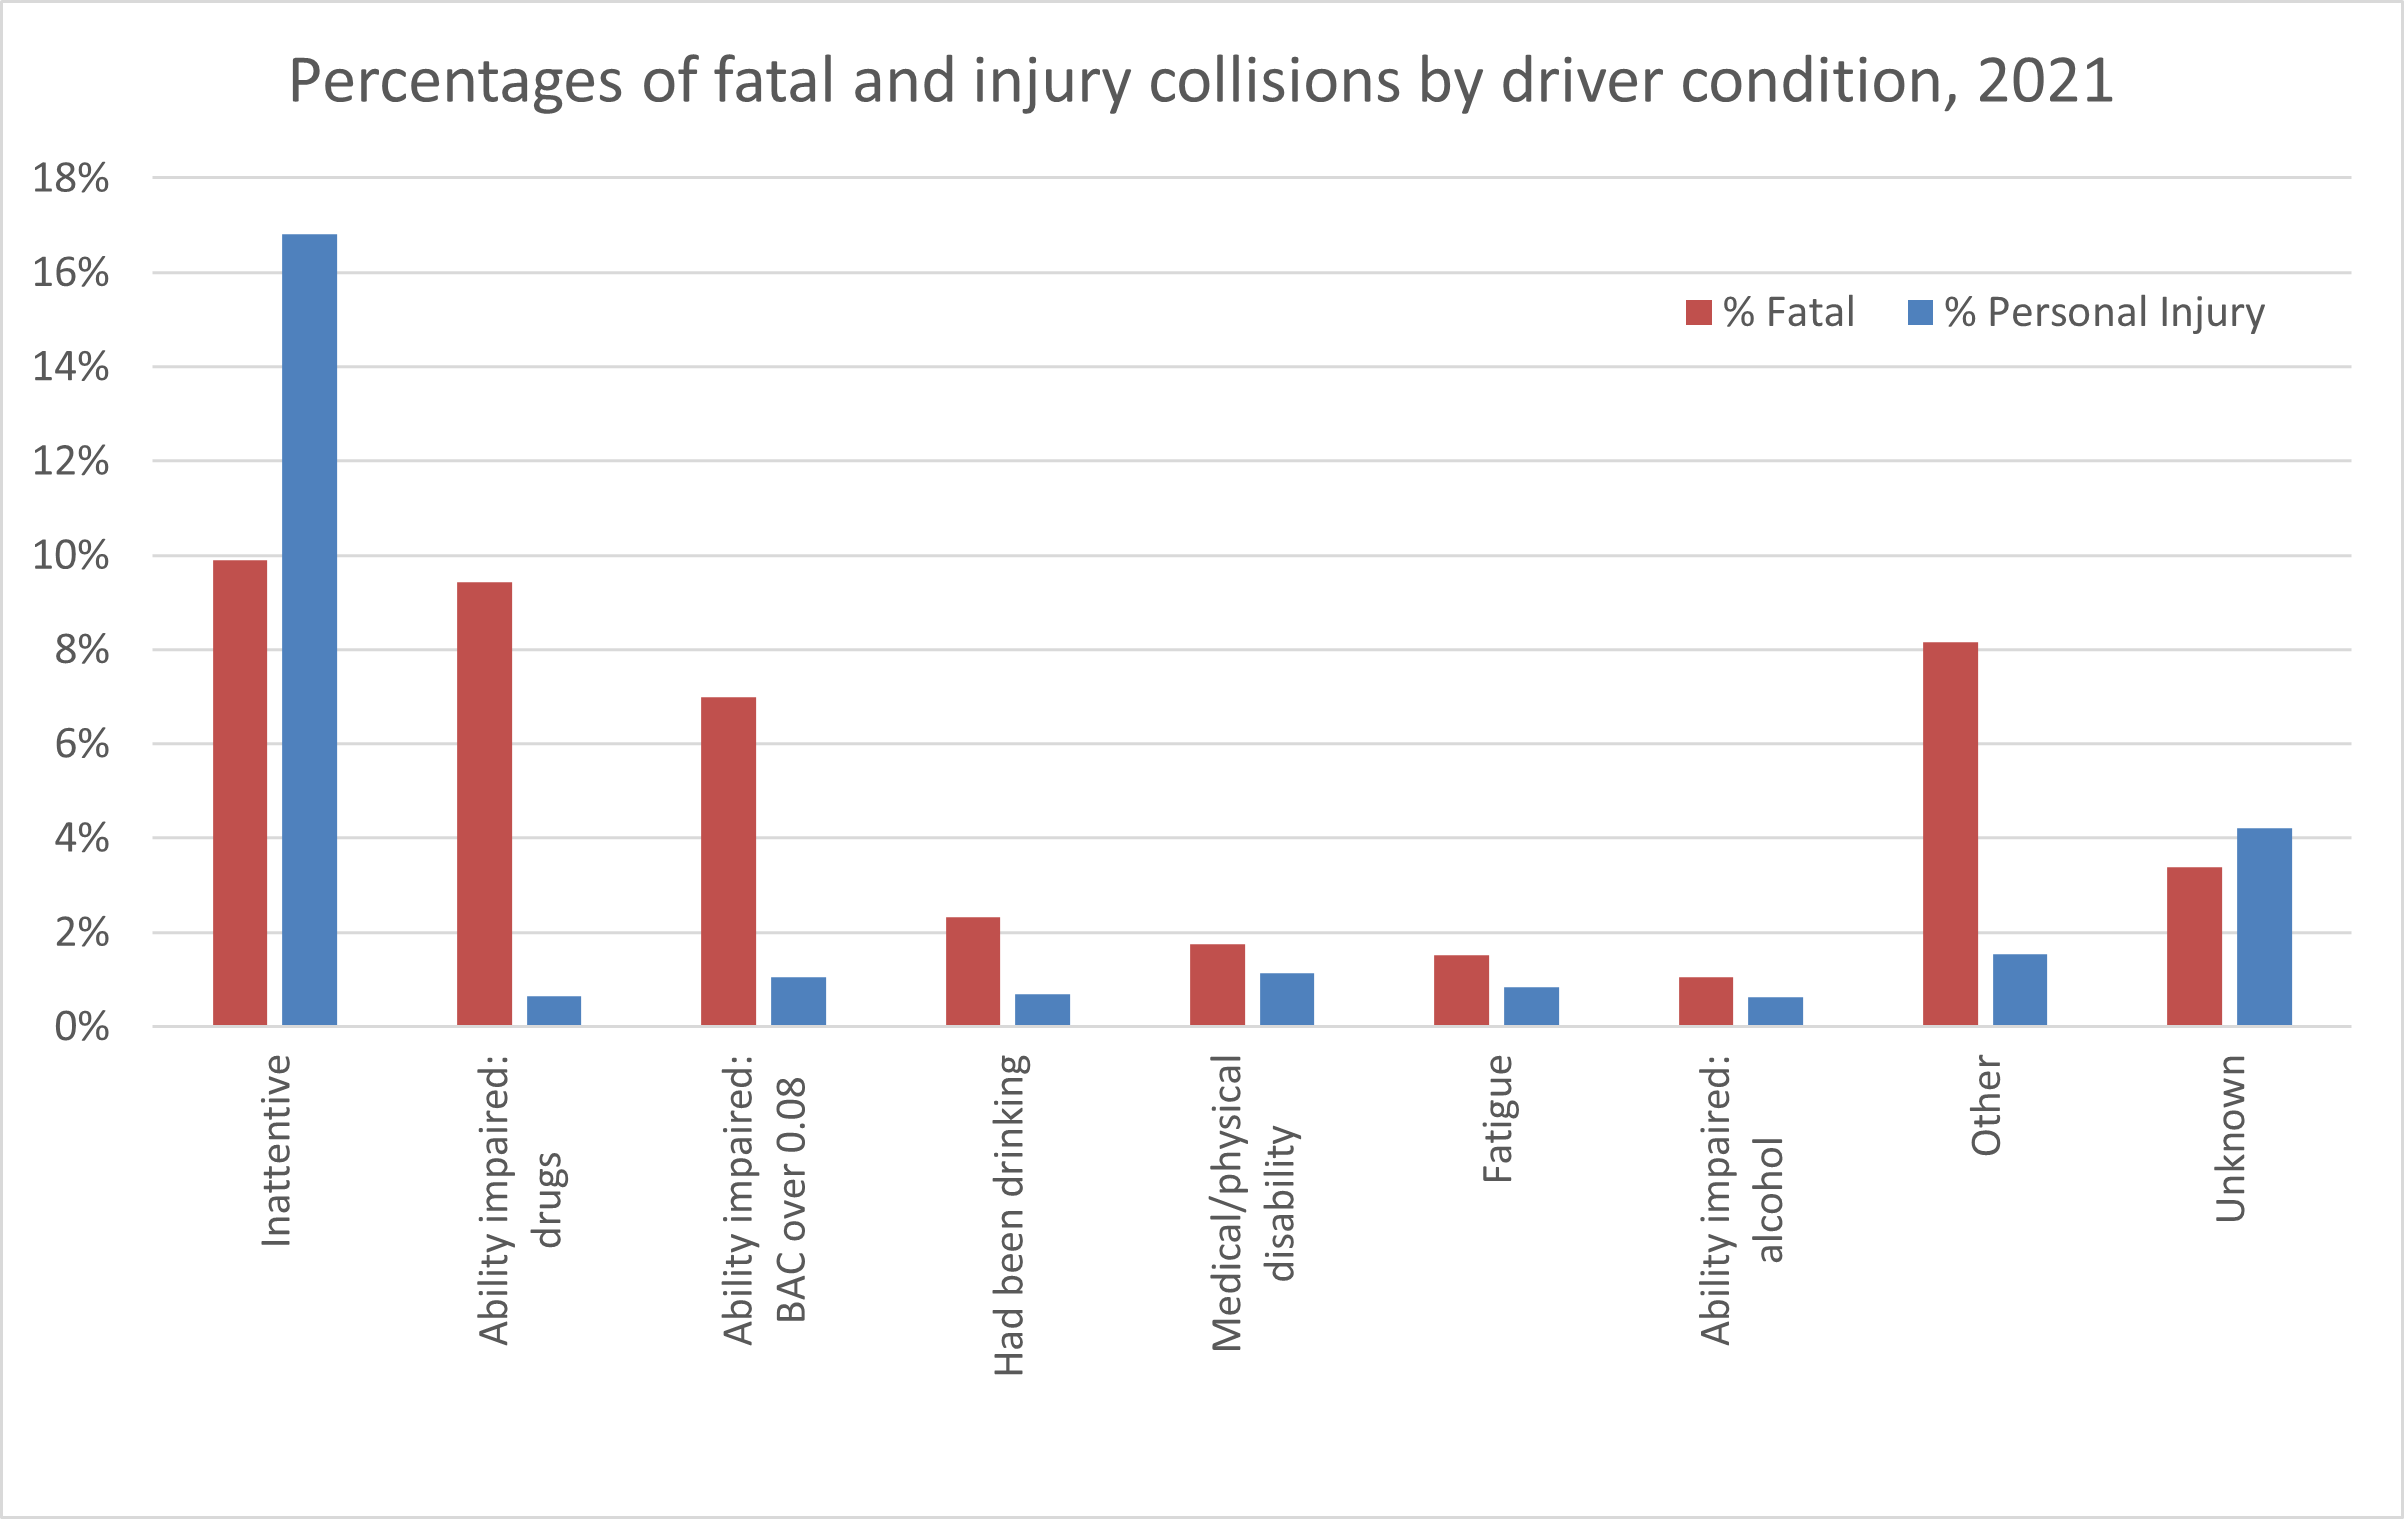
- No unusual driver conditions were identified in 55.5% of fatal collisions, 72.6% of personal injury collisions, and 76.1% of property damage-only collisions in Ontario in 2021. The following chart shows the percentages of fatal and injury collisions where some driver conditions were identified. The most frequent driver condition for both fatal and injury collisions was inattentiveness, likely caused by distractions. Inattentiveness was by far the most frequently identified (16.8%) driver condition in injury collisions. The two next most common driver conditions in injury collisions were medical/physical disability (1.1%) and a blood alcohol concentration (BAC) over 0.08% (1.0%).
For fatal collisions, the three most frequently identified driver conditions were inattentiveness (9.9% of fatal collisions), impairment by drugs (9.4%), and a BAC over 0.08% (7.0%). In the following chart, “unknown” refers to situations in which the enforcement officer could not determine whether any driver conditions were involved (such as in hit-and-run collisions). The available statistics would seem to indicate that driver fatigue was associated with only 1.5% of fatal crashes and 0.8% of personal injury crashes. However, these figures may well be underestimates, given the difficulty of objectively assessing or testing for fatigued driving (especially if the driver was killed in the crash). (Ontario Ministry of Transportation, 2024a)
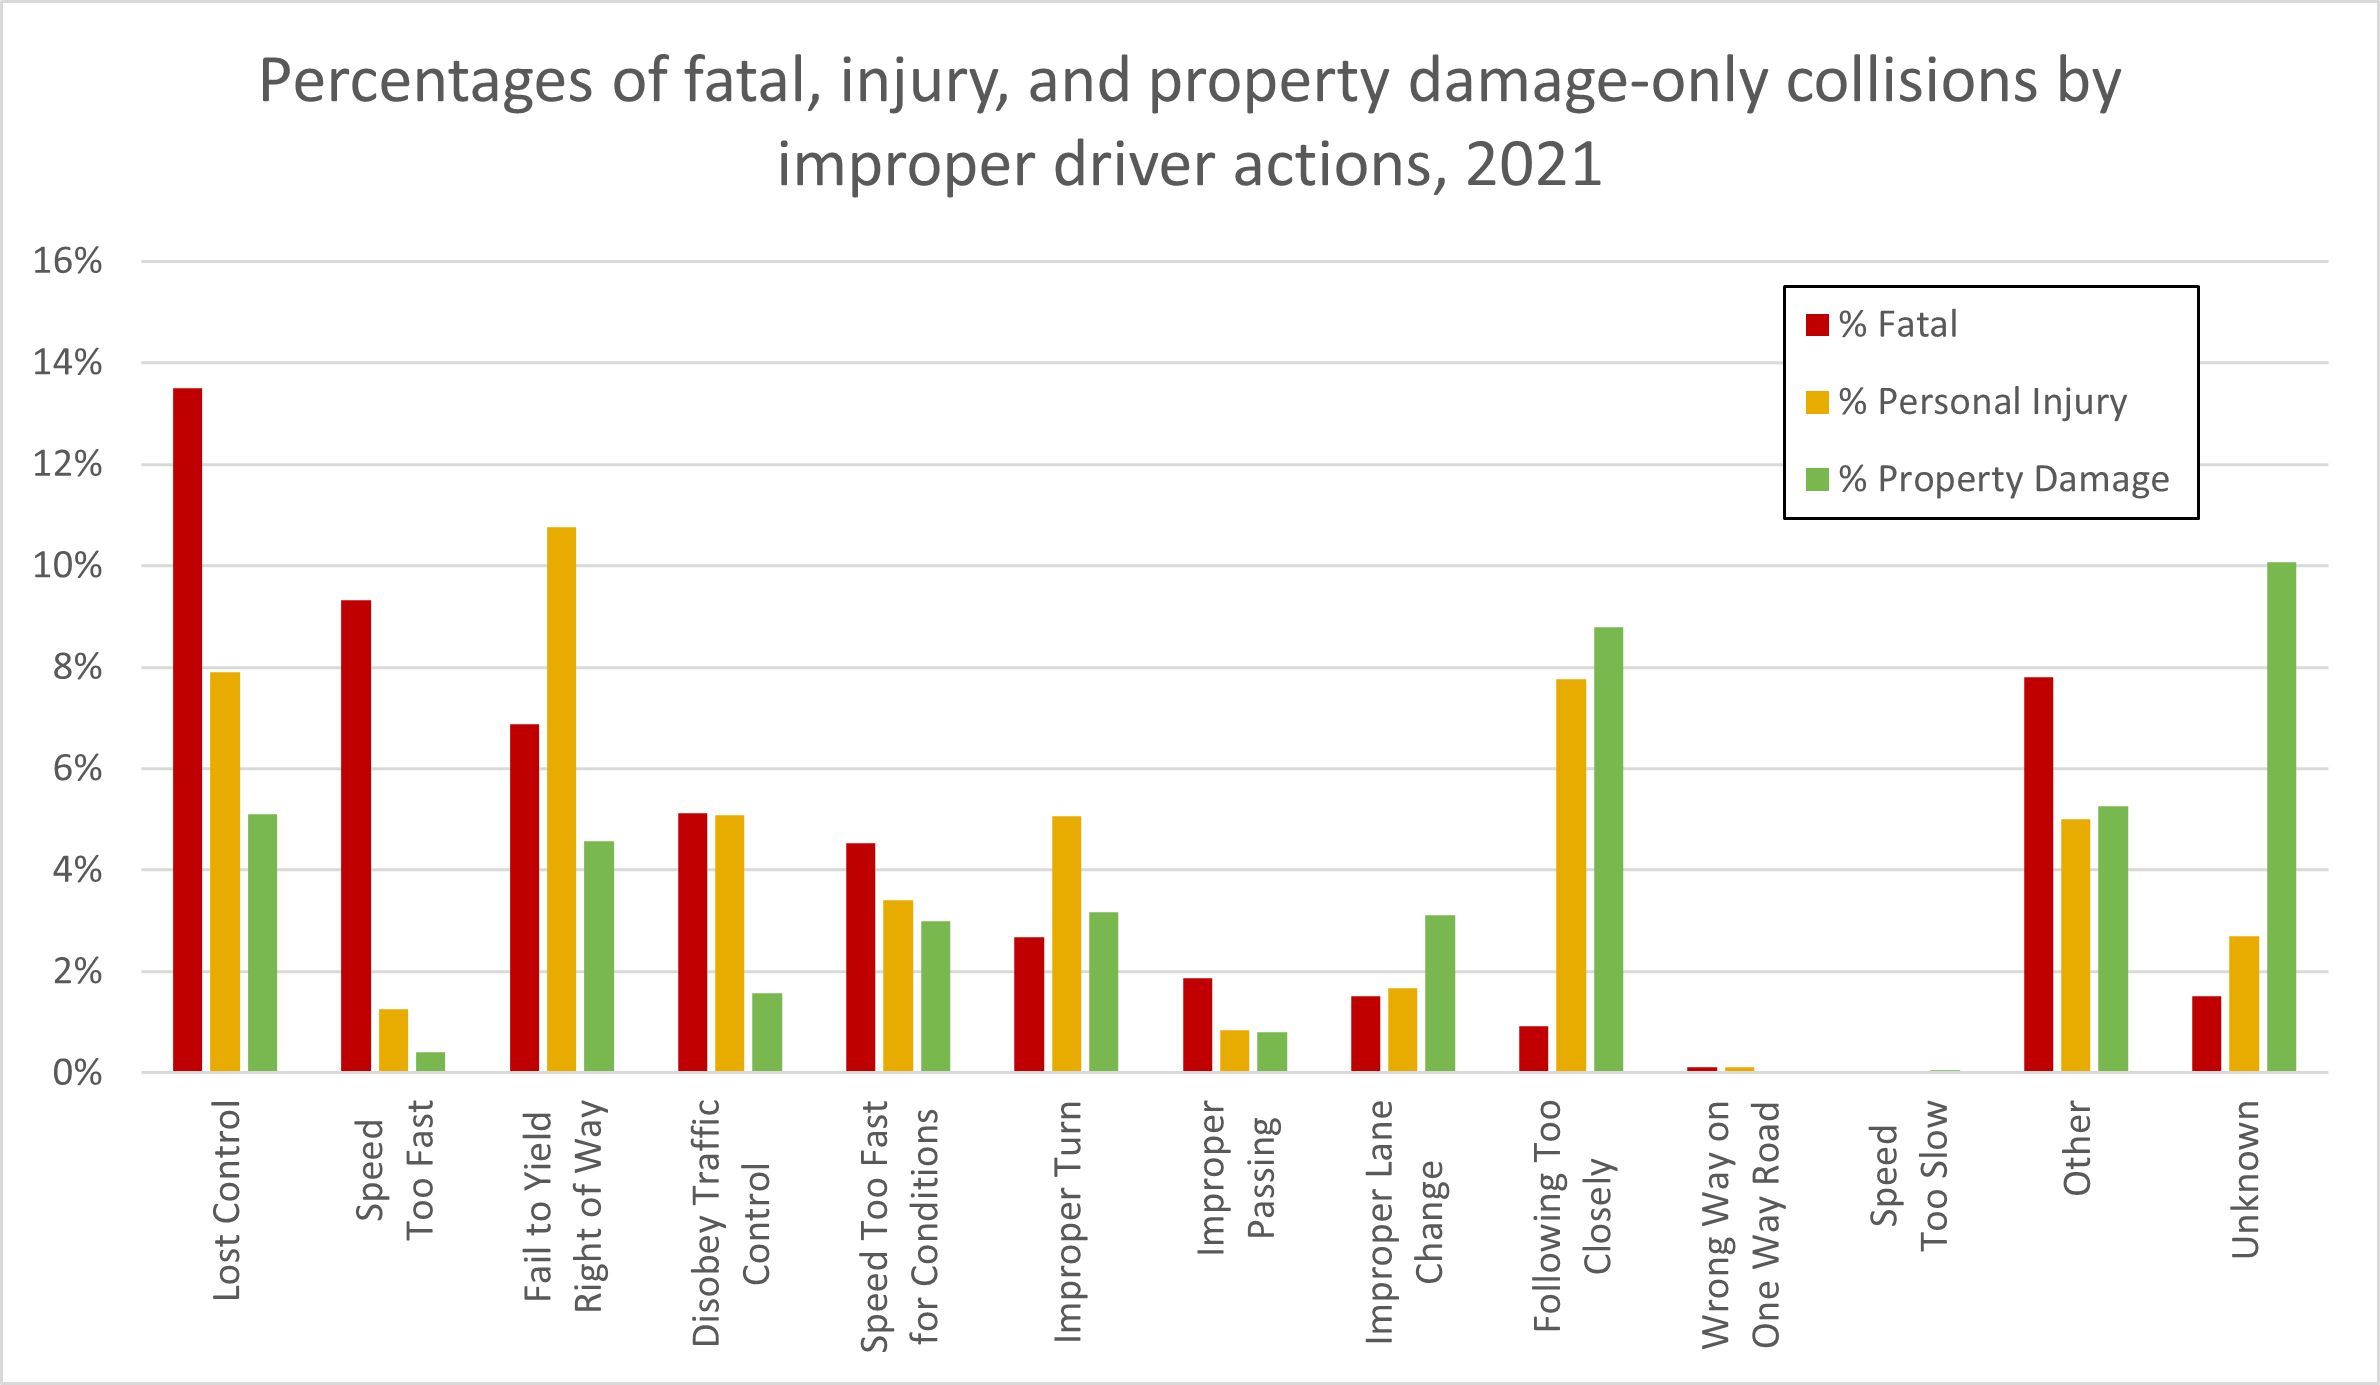
- In 2021, no improper driver actions were identified in 44.2% of fatal collisions, 48.4% of personal injury collisions, and 54.1% of property damage-only collisions. (In other words, each of these drivers was probably driving properly.) The following chart shows the percentages of fatal collisions, personal injury collisions, and property damage-only collisions in which various improper driver actions were identified.
The most frequently identified improper driver action in fatal collisions in 2021 was losing control of the vehicle (13.5% of fatal collisions). The second most frequent driver action was exceeding the speed limit (9.3%). For injury collisions, the most frequently identified action was failing to yield the right of way (10.8%). For property damage-only collisions, it was following too closely (tailgating) (8.8%). (The category “Other” includes such miscellaneous improper actions as driving on the wrong side of the road and improper or illegal parking.) (Ontario Ministry of Transportation, 2024a)
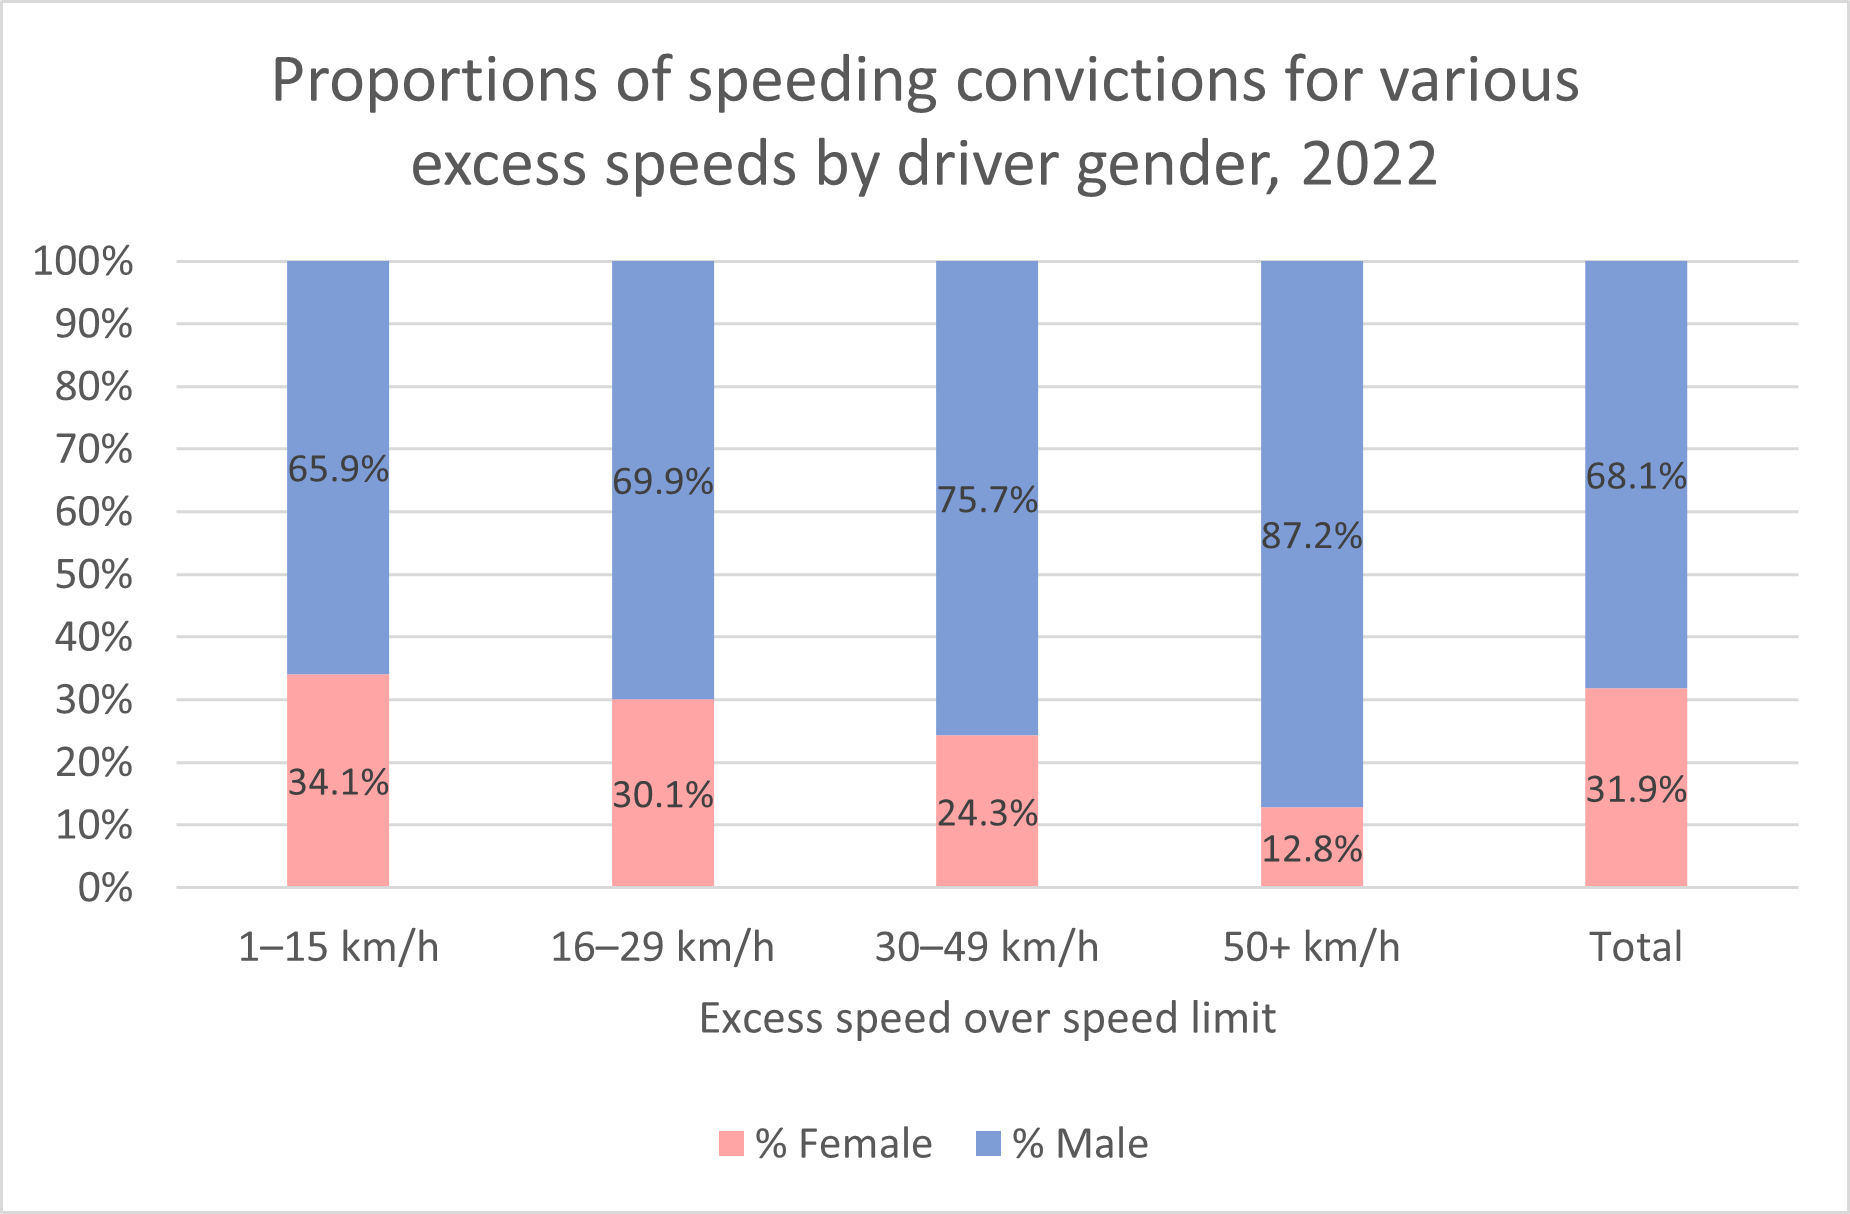
- The more that the speed limit is exceeded, the more likely that the driver is male. In 2022, male drivers (all driver licence classes) accounted for 68.1% of speeding convictions, and female drivers accounted for 31.9%. Male drivers accounted for 87.2% of convictions for exceeding the speed limit by 50 km/h or more. See the following chart. (Ontario Ministry of Transportation, 2023b)
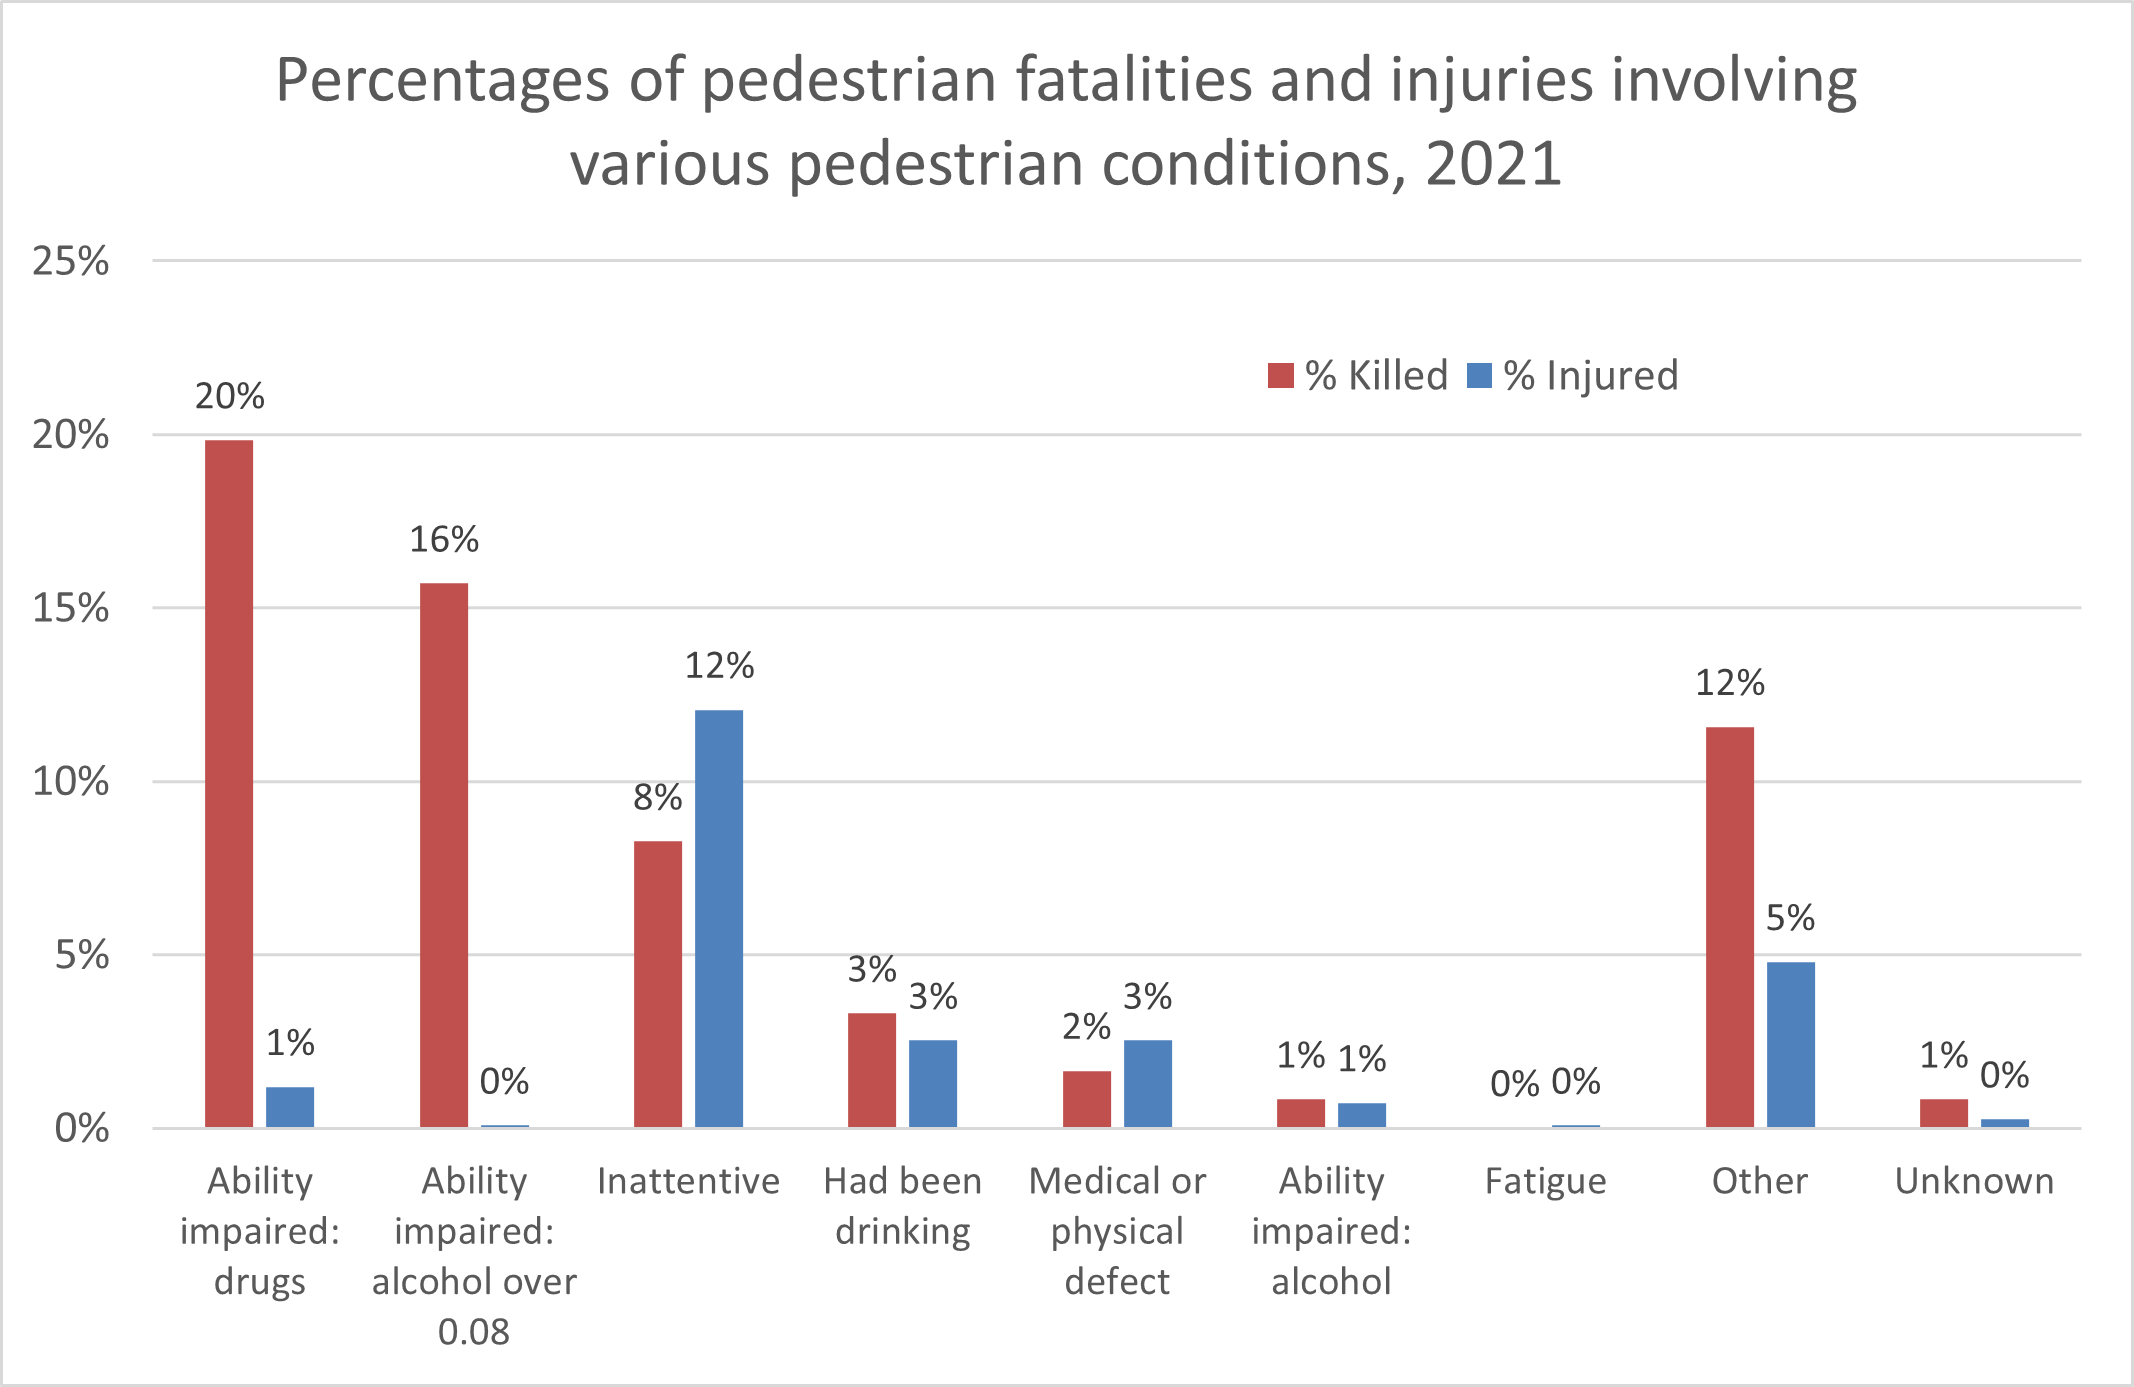
- In Ontario in 2021, no unusual pedestrian conditions were identified in 38% of pedestrian fatalities and 76% of pedestrian injuries. The following chart shows the percentages of pedestrian fatalities and injuries where some pedestrian conditions were identified. (All percentages are stated to two significant figures because of the relatively small sample size.) The most frequently identified condition in fatally injured pedestrians was impairment by drugs or alcohol. The next most common condition in pedestrian fatalities was inattentiveness, which was also the most common identified condition in injured pedestrians. The incidence of fatigue in fatally injured pedestrians may be an underestimate because of the difficulty of ascertaining whether a fatally injured pedestrian was fatigued at the time of the collision. (Ontario Ministry of Transportation, 2024a)
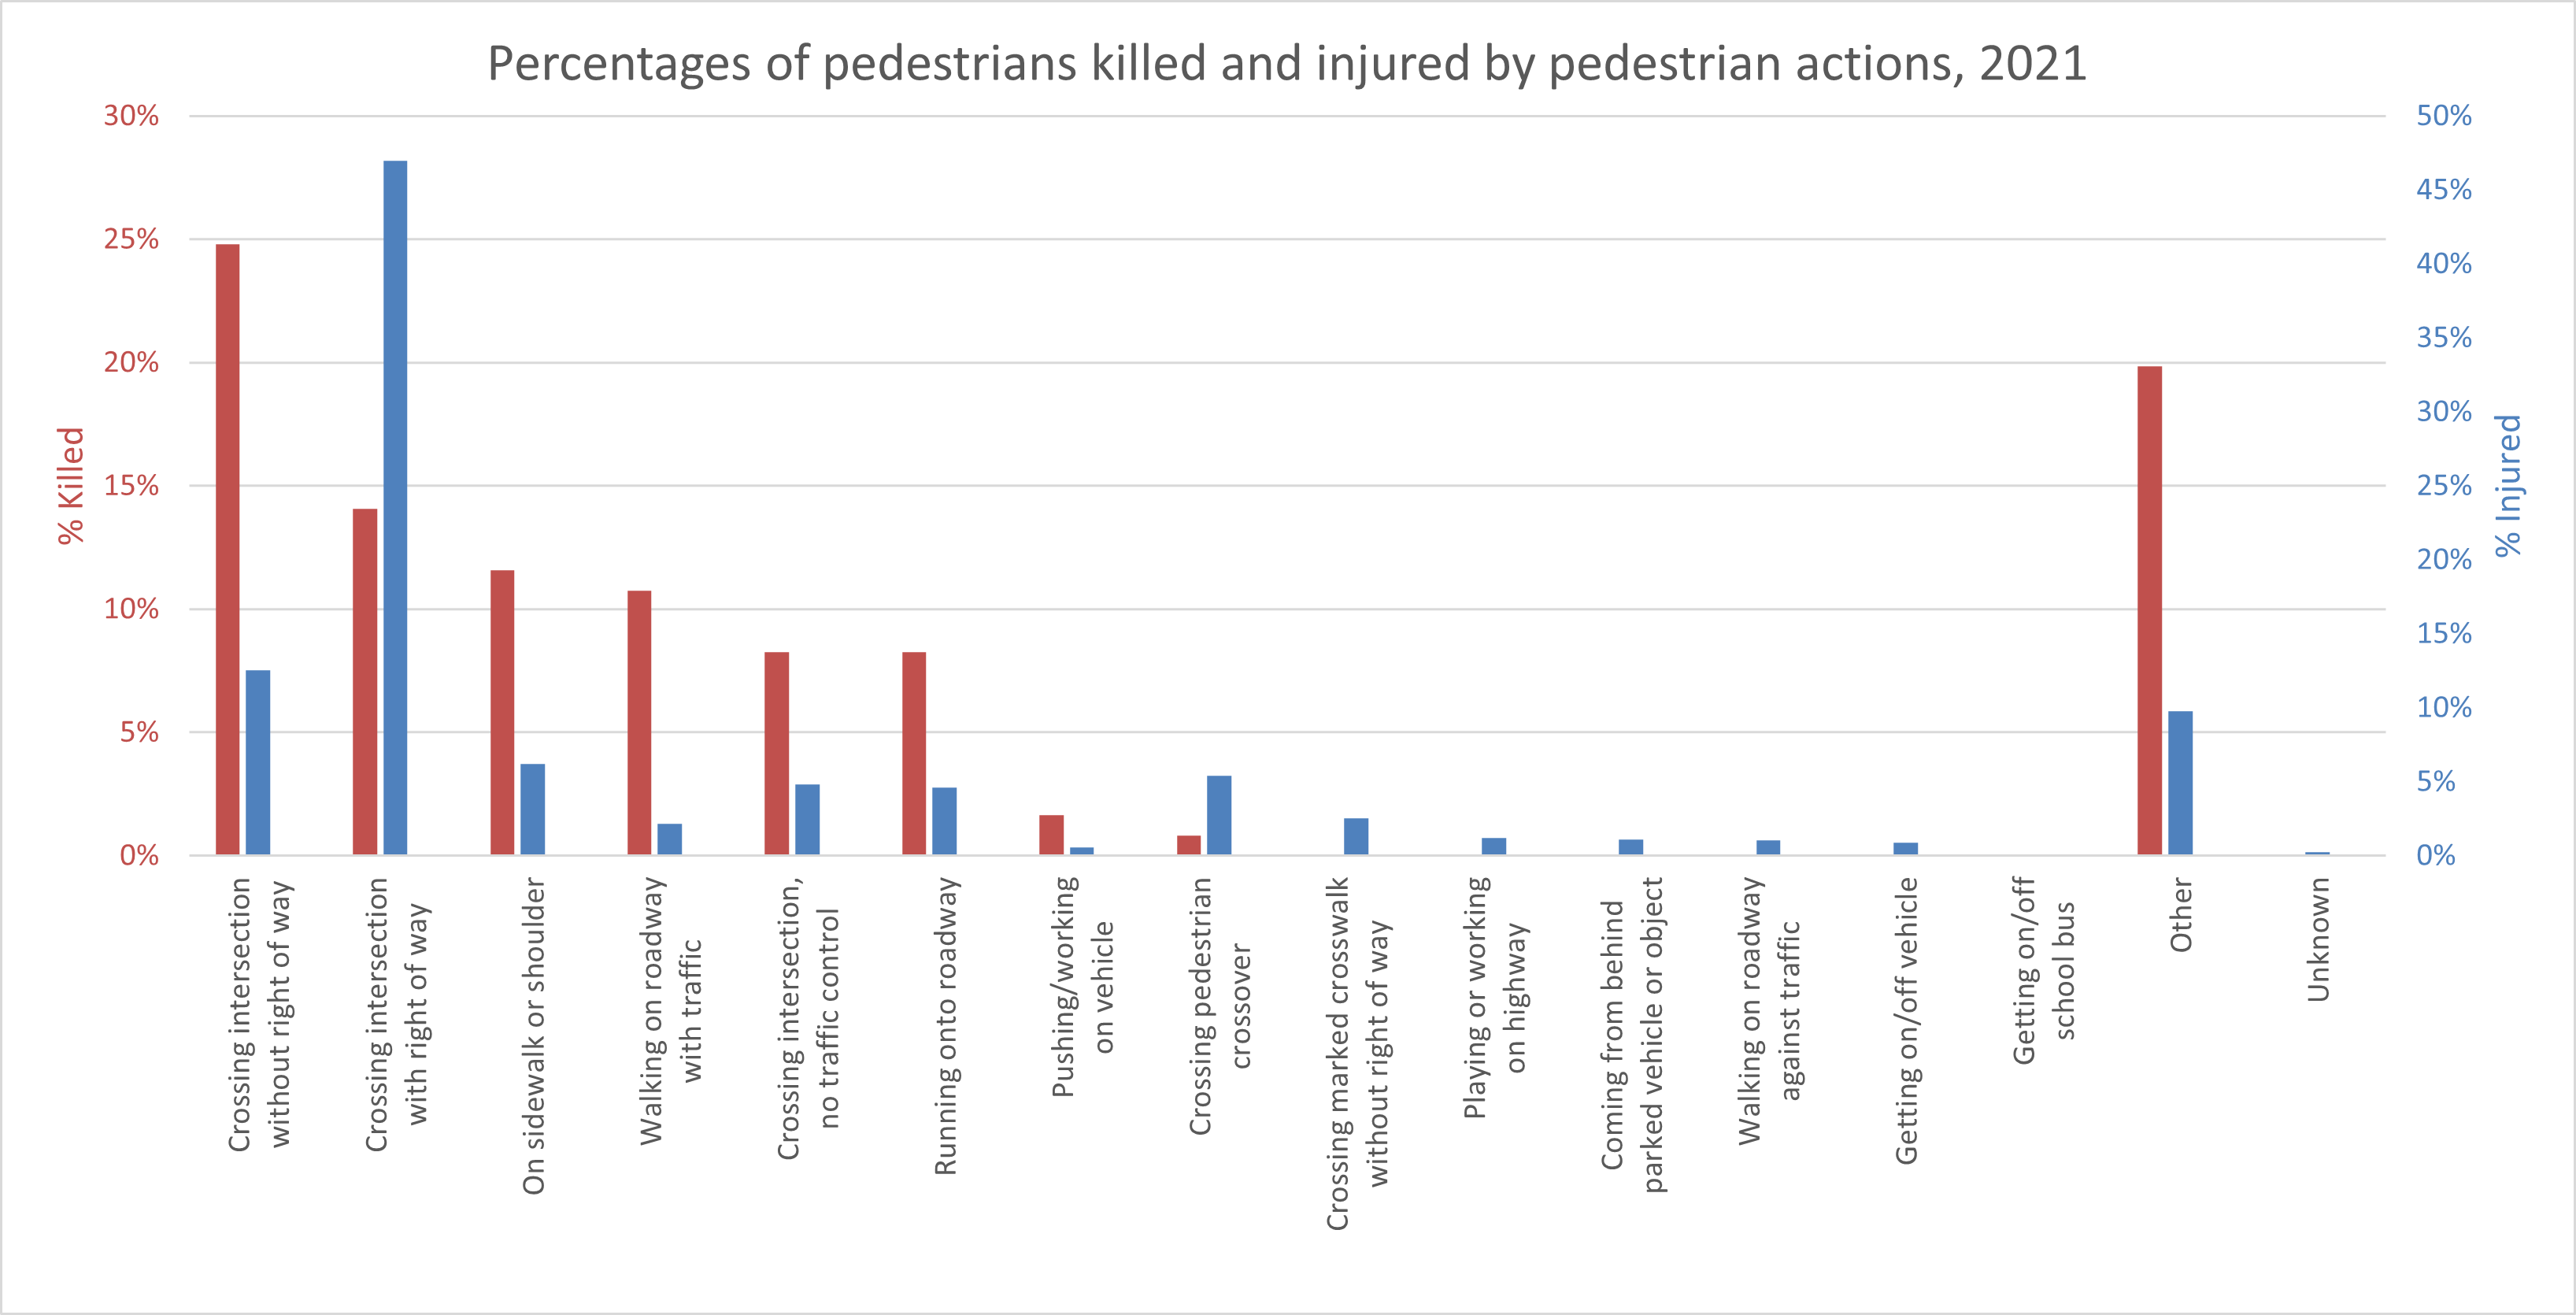
- The following chart lists the percentages of pedestrian fatalities and injuries that involved various actions of the pedestrian. The most commonly identified pedestrian actions in pedestrian fatalities were crossing an intersection without the right of way, crossing an intersection with the right of way, and walking on the sidewalk or shoulder. 47% – nearly half – of injured pedestrians had the right of way, but this did not save them from injury. The next most common pedestrian actions before the pedestrian was injured were crossing without the right of way and walking on the sidewalk or shoulder. (Ontario Ministry of Transportation, 2024a)
- In 2021, just 1.0% of the vehicles involved in collisions in Ontario had an identified mechanical defect that could have contributed to the collision. Even the most frequent defect, tire puncture or blowout, was involved in fewer than 0.1% of collisions. The second most common defect, service brakes defective, was involved in fewer than 0.1% of collisions. (Ontario Ministry of Transportation, 2024a)
- In 2021, there were 107 fatalities in collisions involving large trucks. In 39 (36%) of these fatalities, the truck driver was judged not driving properly. Only 2% of the fatal truck collisions involved a truck with an apparent defect that might have contributed to the crash. 83% of truck crashes occurred in clear weather, and 70% occurred in daylight. Truck driver impairment by alcohol was a factor in only 2% of fatal crashes involving large trucks. (Ontario Ministry of Transportation, 2024a)
- In 2021, there were 83 people killed in collisions involving an inattentive (distracted) driver. Inattentive driving was a factor in 15% of all fatalities on Ontario’s roads in 2021. (Ontario Ministry of Transportation, 2024a)
- In a 2023 survey of 3,007 Ontarians’ behaviour during the past year, 4.5% of drivers (7.2% of male drivers, 2.0% of female drivers) admitted to driving after consuming two or more alcoholic drinks in the previous hour. 2.8% of drivers (3.5% of male drivers, 2.3% of female drivers) admitted to driving after using cannabis in the previous hour. (Hamilton and Nigatu, 2023)
- In 2021, 133 people were killed in collisions involving a drunk driver. However, Ontario’s drinking and driving fatality rate was only 0.08 persons per 10,000 licensed drivers. This was 89% lower than the rate of 0.72 persons per 10,000 licensed drivers in 1988. (Ontario Ministry of Transportation, 2024a)
- In 2021, 86 people were killed in collisions involving a drugged driver. (Ontario Ministry of Transportation, 2024a)
- The following table lists the contributing factors involving the most fatalities in 2021, along with the number of fatalities and the percentage of the total. (Note that these percentages do not add up exactly to 100% because some fatalities involved more than one contributing factor.) (Ontario Ministry of Transportation, 2024a)
|
Category |
Fatalities |
% of Total Fatalities |
|
Speed related |
129 |
23% |
|
Pedestrians |
121 |
22% |
|
Large trucks |
107 |
19% |
|
Drinking and driving |
96 |
17% |
|
Drug impaired |
86 |
15% |
|
Inattentive driving |
83 |
15% |
|
Motorcyclists |
76 |
14% |
|
Unbelted occupants |
67 |
12% |
|
Cyclists |
16 |
3% |
|
Senior drivers |
15 |
3% |
|
Young drivers |
9 |
2% |
- Some roads and traffic intersections in Ontario are much more dangerous than others. Highway 401 between Windsor and London (nicknamed “Carnage Alley”) has long been notorious for its frequent collisions, many of which involved death or injury. Highway 11 has had numerous collisions, many of which involved large trucks. This road wends its way through northern Ontario, with single-lane road sections, decreased visibility caused by lake-effect snowstorms, and limited places to pull over in case of a breakdown. However, a CAA poll of drivers in 2025 found that for the second straight year, drivers most often cited Aberdeen Avenue in Hamilton as Ontario’s worst road because of its numerous potholes and traffic congestion. Use extra caution if you drive on these roads.
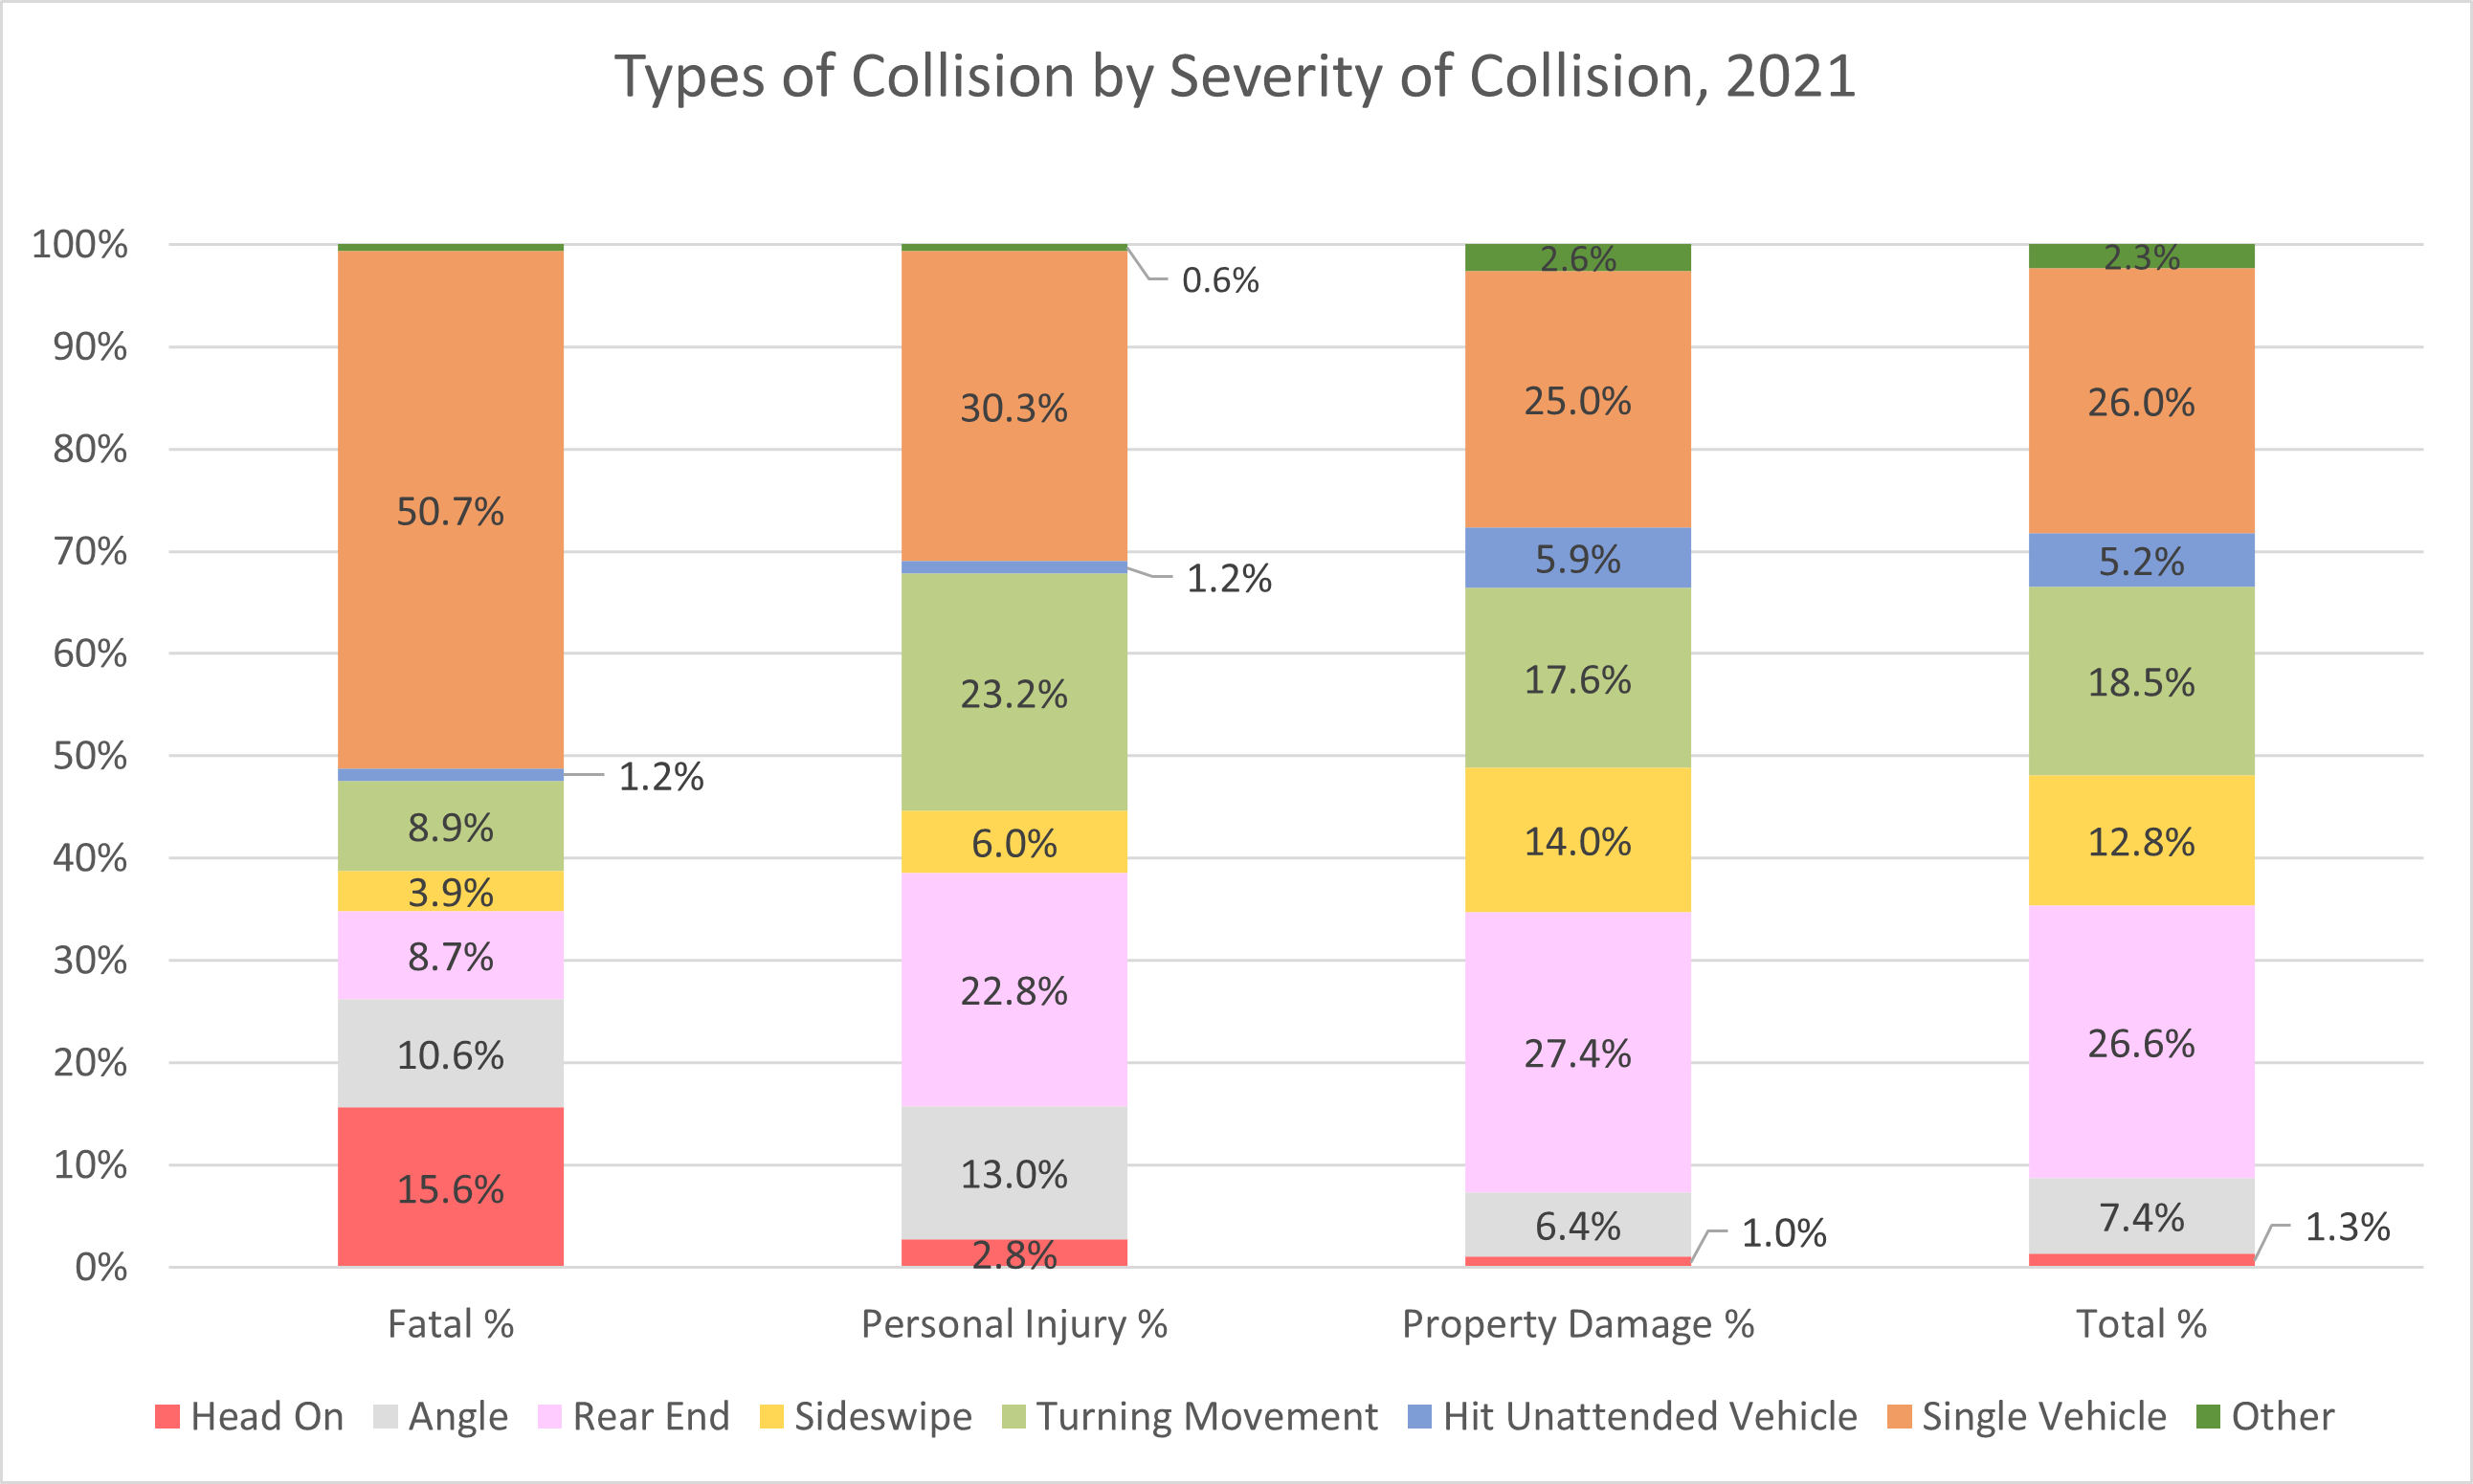
- In 2021, the most common type of collision in Ontario was the rear-end collision, which was also the most common type of collision involving more than one vehicle. The second most common type of collision, only slightly less frequent than the rear-end collision, was the single-vehicle collision, which usually involved running off the road or striking a stationary object. Some types of collisions were more likely to cause death or personal injury than others. Head-on (front-impact) collisions represented only 1.3% of total collisions (which included property-damage collisions) but 15.6% of fatal collisions and 2.8% of personal injury collisions. Single-vehicle collisions represented 26.0% of total collisions but 50.7% of fatal collisions and 30.3% of injury collisions. On the other hand, striking an unattended vehicle represented 5.2% of total collisions but only 1.2% of fatal collisions and 1.2% of injury collisions. See the following chart. (Ontario Ministry of Transportation, 2024a)
- In 2021, there were 54 road fatalities in Ontario among drivers aged 75 or older. The number of licensed senior drivers in Ontario has risen much faster than the total number of licensed drivers of all ages. From 2002 through 2021, the number of licensed drivers increased by 29.3%, from 8,413,504 to 10,877,259. However, the number of licensed drivers aged 65 and older nearly doubled, from 1,075,439 to 2,105,879, an increase of 95.8%. (Ontario Ministry of Transportation, 2024a)
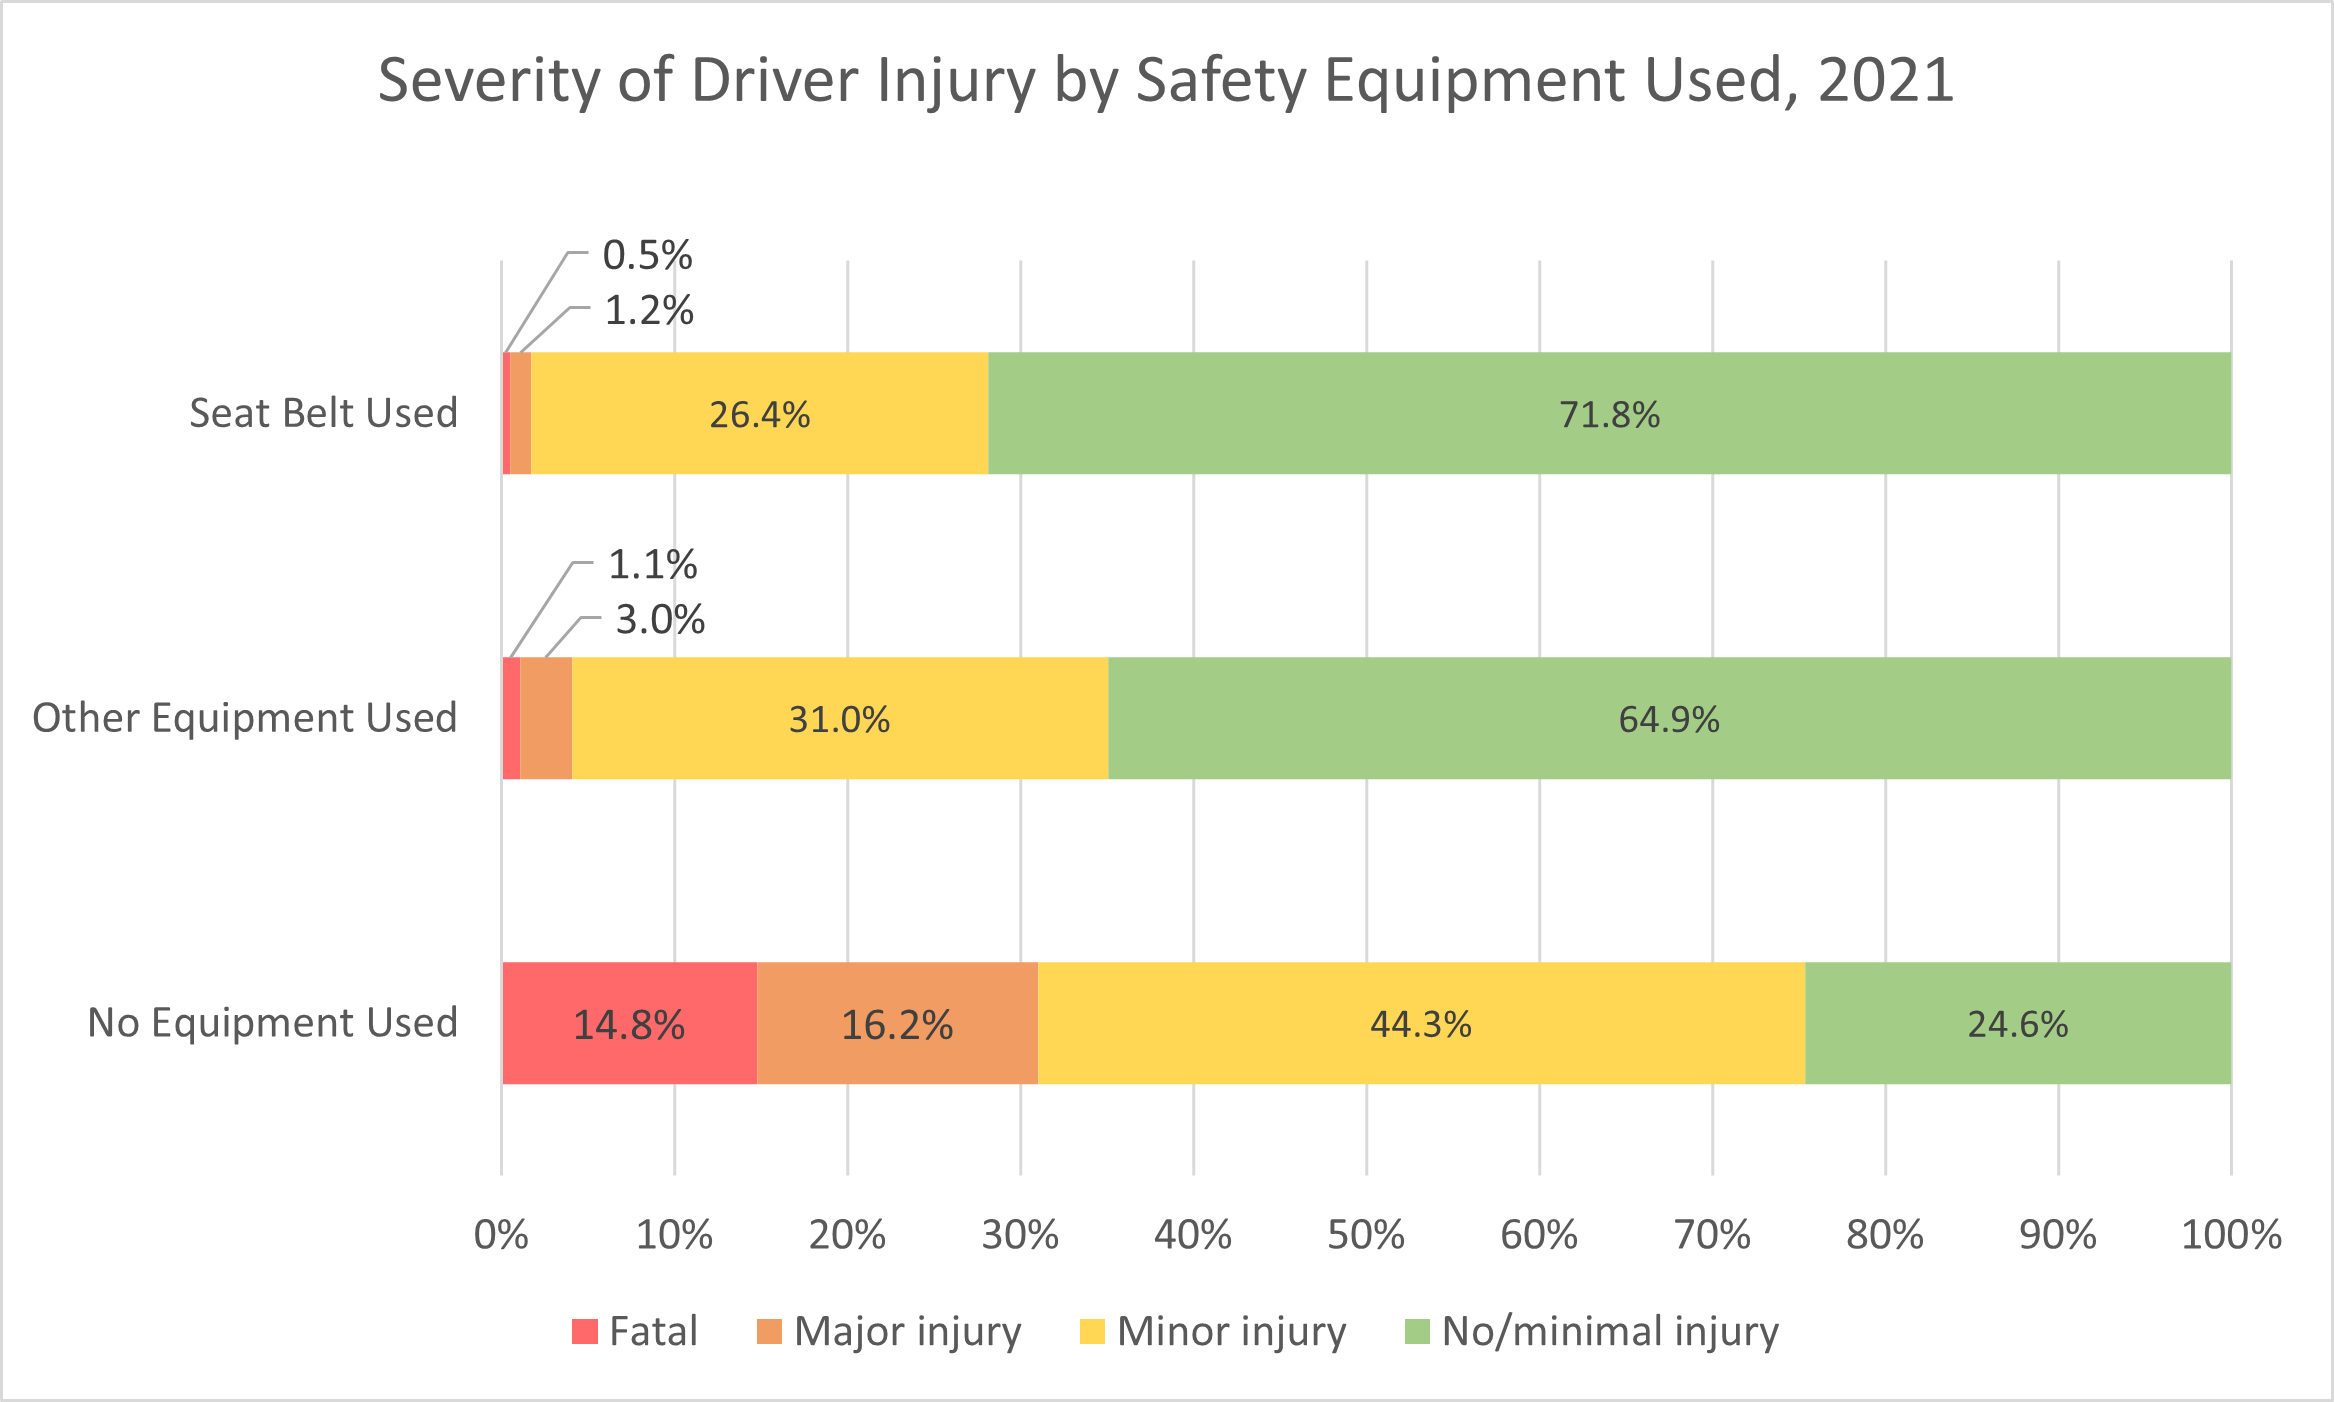
- Ontario has had a 96% seatbelt usage rate. Nevertheless, about one in five vehicle occupants killed on Ontario’s roads was unbelted. The following chart compares injury outcomes for drivers in collisions in 2021 according to safety equipment used: drivers who wore seatbelts, drivers who used other safety equipment (usually airbags) but not seatbelts, and drivers who did not use any safety equipment. Drivers wearing seatbelts had the best outcomes: 71.8% of them escaped with minimal or no injuries. Only 0.5% of them were killed, and 1.2% of them suffered major injuries (i.e., injuries requiring hospitalization). Drivers who relied only on other safety equipment, chiefly airbags, fared a bit less well: 1.1% were killed and 3.0% suffered major injuries. Drivers who did not use any safety equipment had the worst outcomes: 14.8% of them were killed and 16.2% suffered major injuries. Only 24.6% of them escaped with minimal or no injuries.
Chi-Square tests of independence yield a p-value < 0.0001 when comparing the injury outcomes for all three safety equipment options and a p-value < 0.0001 when comparing the injury outcomes for seatbelts vs. other safety equipment (chiefly airbags). This means that it is highly likely that the observed differences in injury outcomes are statistically significant in both cases. It also suggests that airbags are not a complete substitute for seatbelts. (Ontario Ministry of Transportation, 2024a)
- In research by the Ontario Ministry of Transportation, some 26% of all fatal and injury crashes and at least 20% of large truck crashes were estimated to be related to fatigued driving. (Traffic Injury Research Foundation, 2009)
- In 2008, the Traffic Injury Research Foundation (TIRF) surveyed Ontario police officers, including RCMP, provincial, and municipal forces. 95.9% of officers surveyed identified fatigued driving as a serious problem, and 89.2% ranked the problem as being as important as, or comparable to, impaired driving. 92.4% of the officers surveyed also stated that they had stopped a driver whom they suspected was impaired, only to discover that the driver was fatigued instead. However, whereas almost all officers considered fatigued driving a serious or extremely serious problem, only 59.6% of Ontario drivers agreed. (Traffic Injury Research Foundation, 2009)
- In a public opinion poll conducted by TIRF, nearly 60% of Ontario drivers, corresponding to some five million people, admitted that they had driven fatigued at least sometimes. Well over a million Ontario drivers (14.5%) also admitted falling asleep or nodding off while driving at least once in the past year. Collectively, these drivers accounted for about 5.5 million trips during which they fell asleep or nodded off. (Traffic Injury Research Foundation, 2009)
- Generally, texting increases one’s crash risk by 23 times. In Ontario, deaths from collisions caused by distracted driving have doubled since 2000. Today, approximately one in every five road fatalities is attributed to distracted driving. (ThinkInsure, April 2024)
- In 2021, there were 561 driving fatalities in Ontario. “Inattentive driving” was a factor in 83 (14.8%) of those fatalities. Ontario defines “inattentive driving” as operating a motor vehicle without due care and attention or placing less concentration on driving. Other examples of inattentive driving are changing radio stations, consuming food, reading, and talking on a phone. However, inattentive driving does not include fatigue, which is treated separately. (Ontario Ministry of Transportation, July 2024)
- One person is injured in a distracted-driving collision every half hour. (ThinkInsure, March 2025)
- In 2016, distracted driving was estimated to have caused 7,435 accidents in Toronto alone. (ThinkInsure, March 2025)
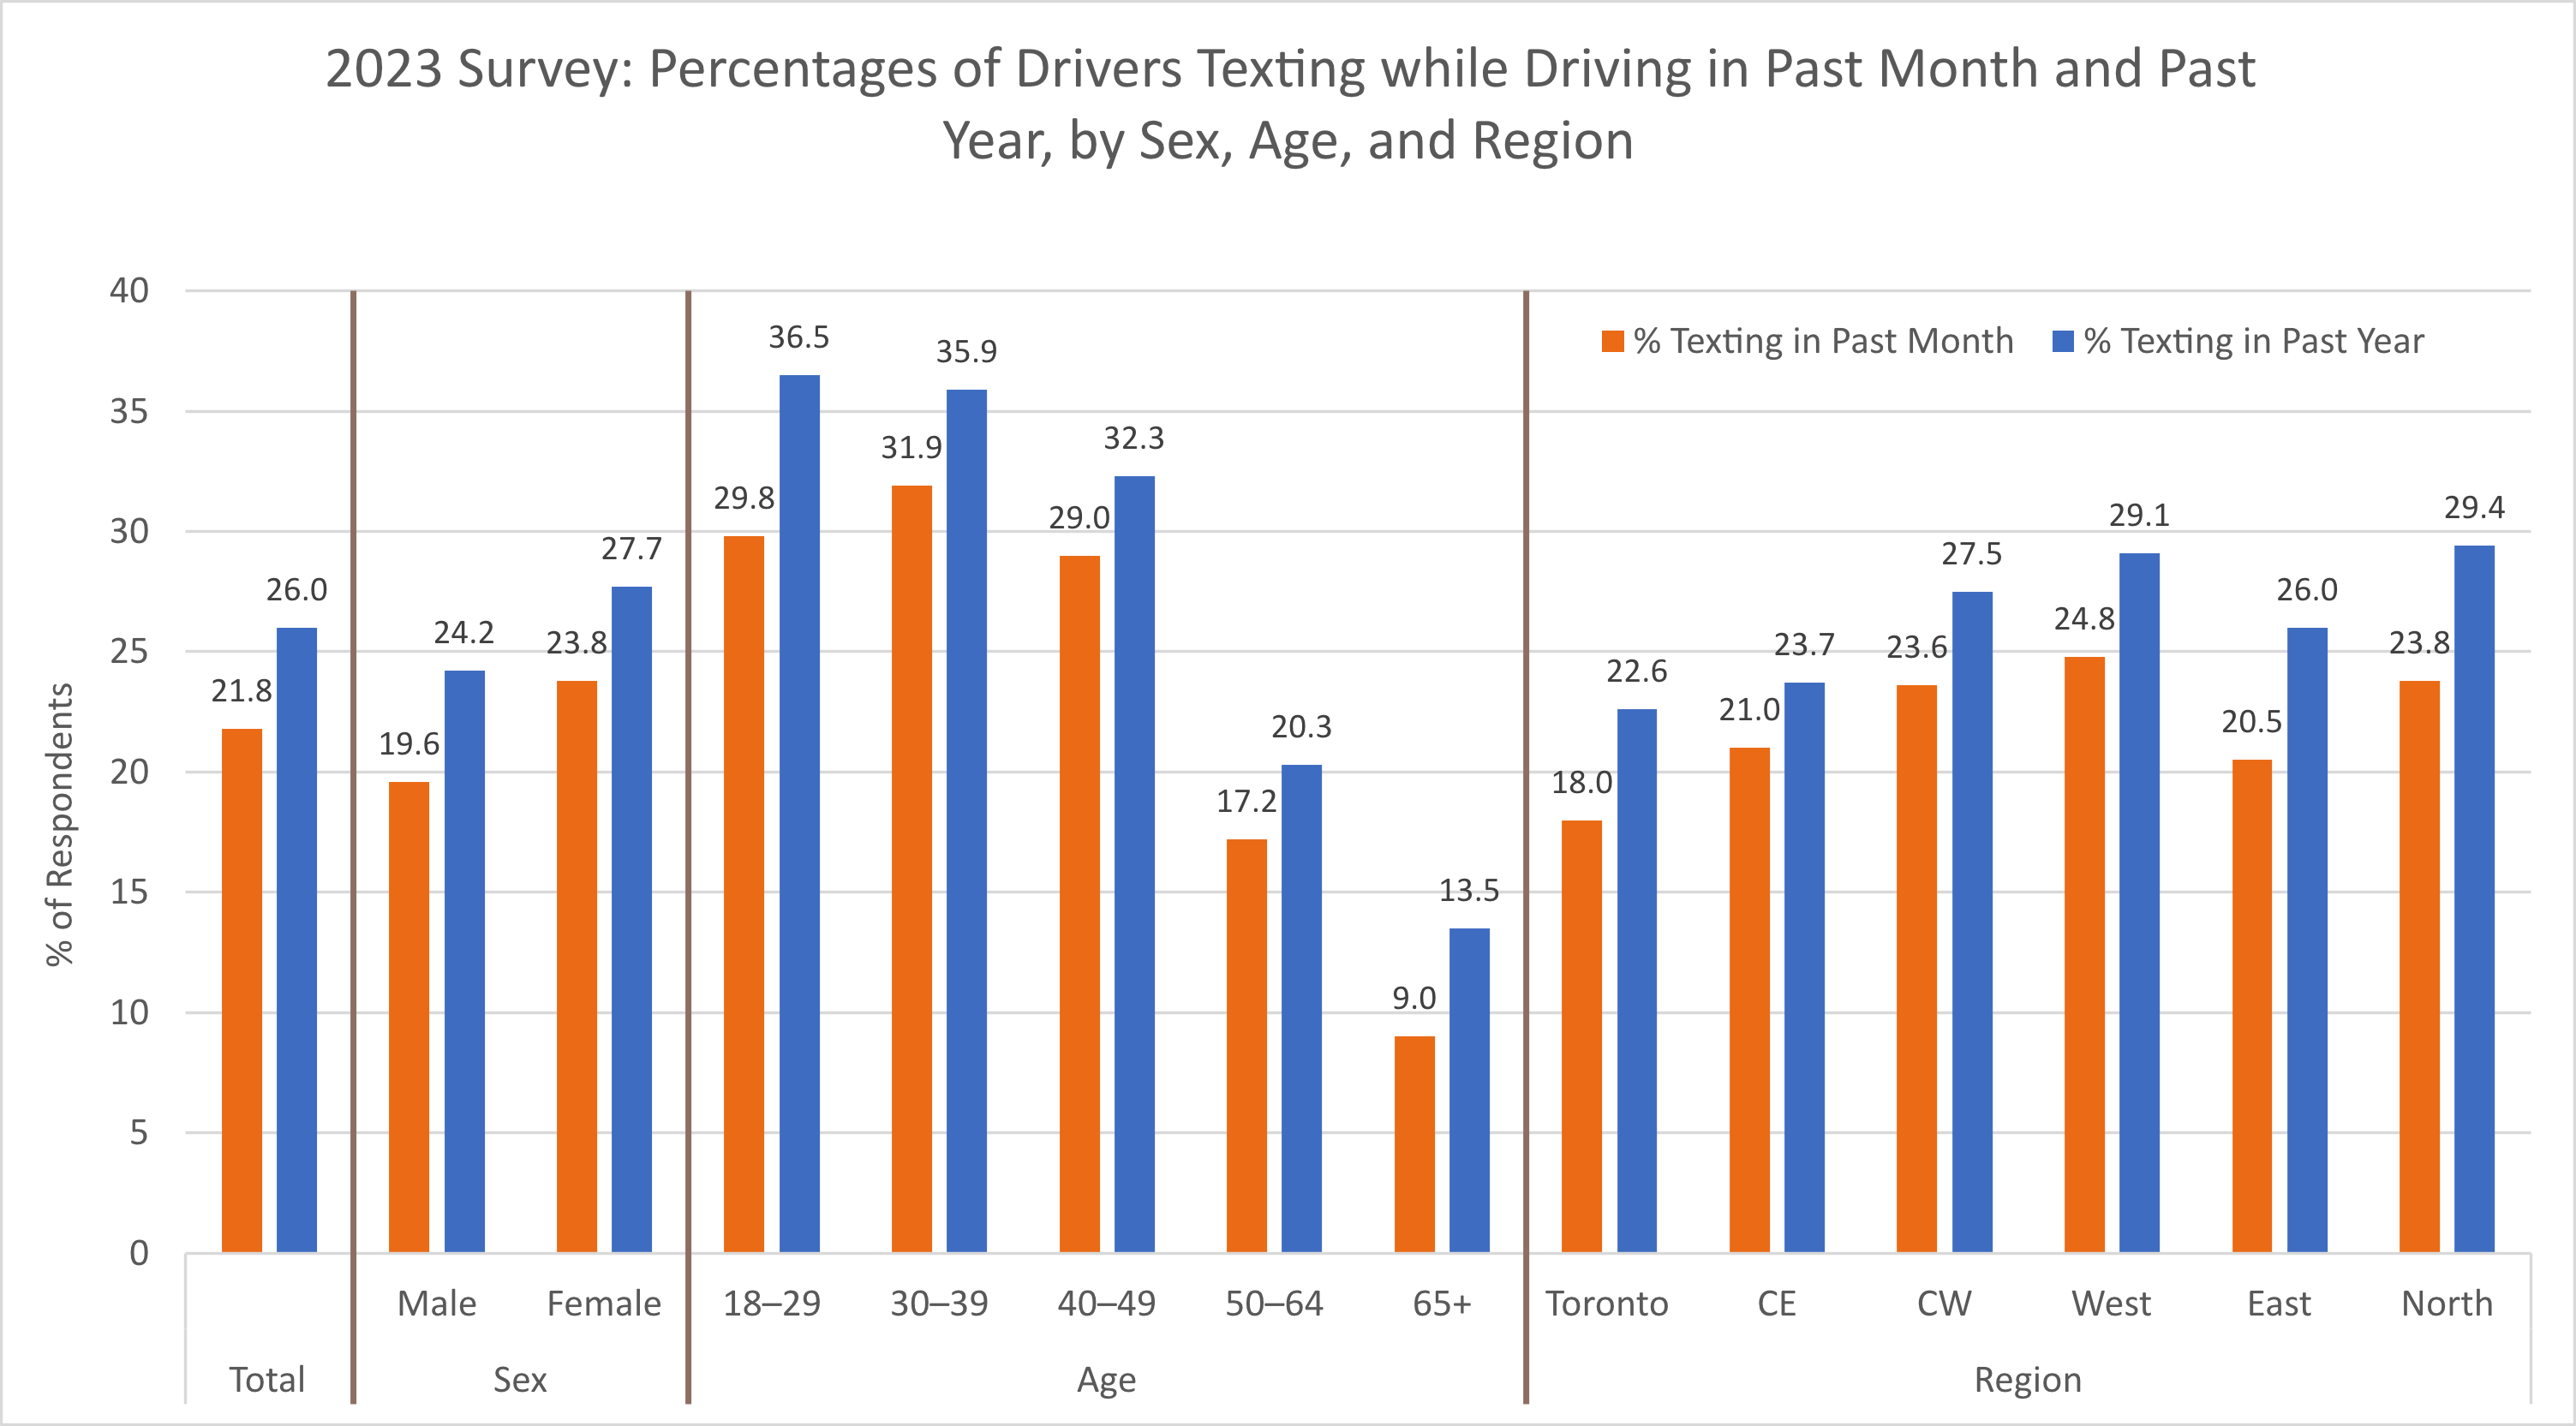
- In a survey of licensed Ontario drivers from January to March 2023, 26.0% of respondents admitted to texting while driving at least once during the past year, and 21.8% of respondents admitted to texting while driving at least once during the past 30 days. Although more female drivers than male drivers reported texting while driving, this difference was not judged significant. Significantly (p-value < 0.05) more younger drivers texted while driving than senior drivers did. Somewhat fewer drivers in the Toronto area texted while driving than drivers in other parts of Ontario did, but this difference was not judged significant either. See the following chart. (Centre for Addiction and Mental Health, 2023)
- In a survey of 10,145 licensed Ontario students from November 2022 to June 2023, 38.7% of students in grades 10 through 12 (41.1% of males, 35.7% of females) admitted they had texted while driving at least once in the past year. 51.0% of Ontario students in grade 12 reported texting while driving within the past year. (Centre for Addiction and Mental Health, 2023)
- In a January – March 2023 CAMH Substance Abuse and Mental Health survey of Ontarians ages 18 and older:
- 4.5% of Ontario drivers (7.2% of males, 2.0% of females) admitted that at least once within the past year, they had driven after drinking two or more alcoholic drinks in the previous hour.
- 2.8% of Ontario drivers (3.5% of males, 2.2% of females) admitted that at least once within the past year, they had driven after using cannabis in the previous hour. (Centre for Addiction and Mental Health, 2023)
- In a survey of Ontario drivers in 2019, 71% of respondents were confident they could drive after using cannabis. Furthermore, 29% of respondents did not believe that cannabis negatively affected their driving. (A. Damon, December 2023)
- In 2021, of the 14,045 motor vehicle convictions related to the Criminal Code, 9,658 (68.8%) were alcohol related. (Ontario Ministry of Transportation, 2024a)
- In 2021, impaired driving was a contributing factor in about 17.5% of fatal collisions:
- alcohol (1.0% of fatal collisions)
- alcohol with a blood alcohol concentration (BAC) over 0.08% (7.0%)
- drugs (9.4%) (Ontario Ministry of Transportation, 2024a)
- In 2021, more fatally injured drivers were impaired by drugs (73) than by alcohol (59). Of the 59 alcohol-impaired drivers, all but three were found to have a blood alcohol concentration (BAC) over 0.08%. (Ontario Ministry of Transportation, 2024a)
- In 1988, the drinking-and-driving fatality rate was about 0.72 fatalities per 10,000 licensed drivers. In 2021, the rate was about 0.08 fatalities per 10,000 licensed drivers, which was about 89% lower than in 1988. (Ontario Ministry of Transportation, 2024a)
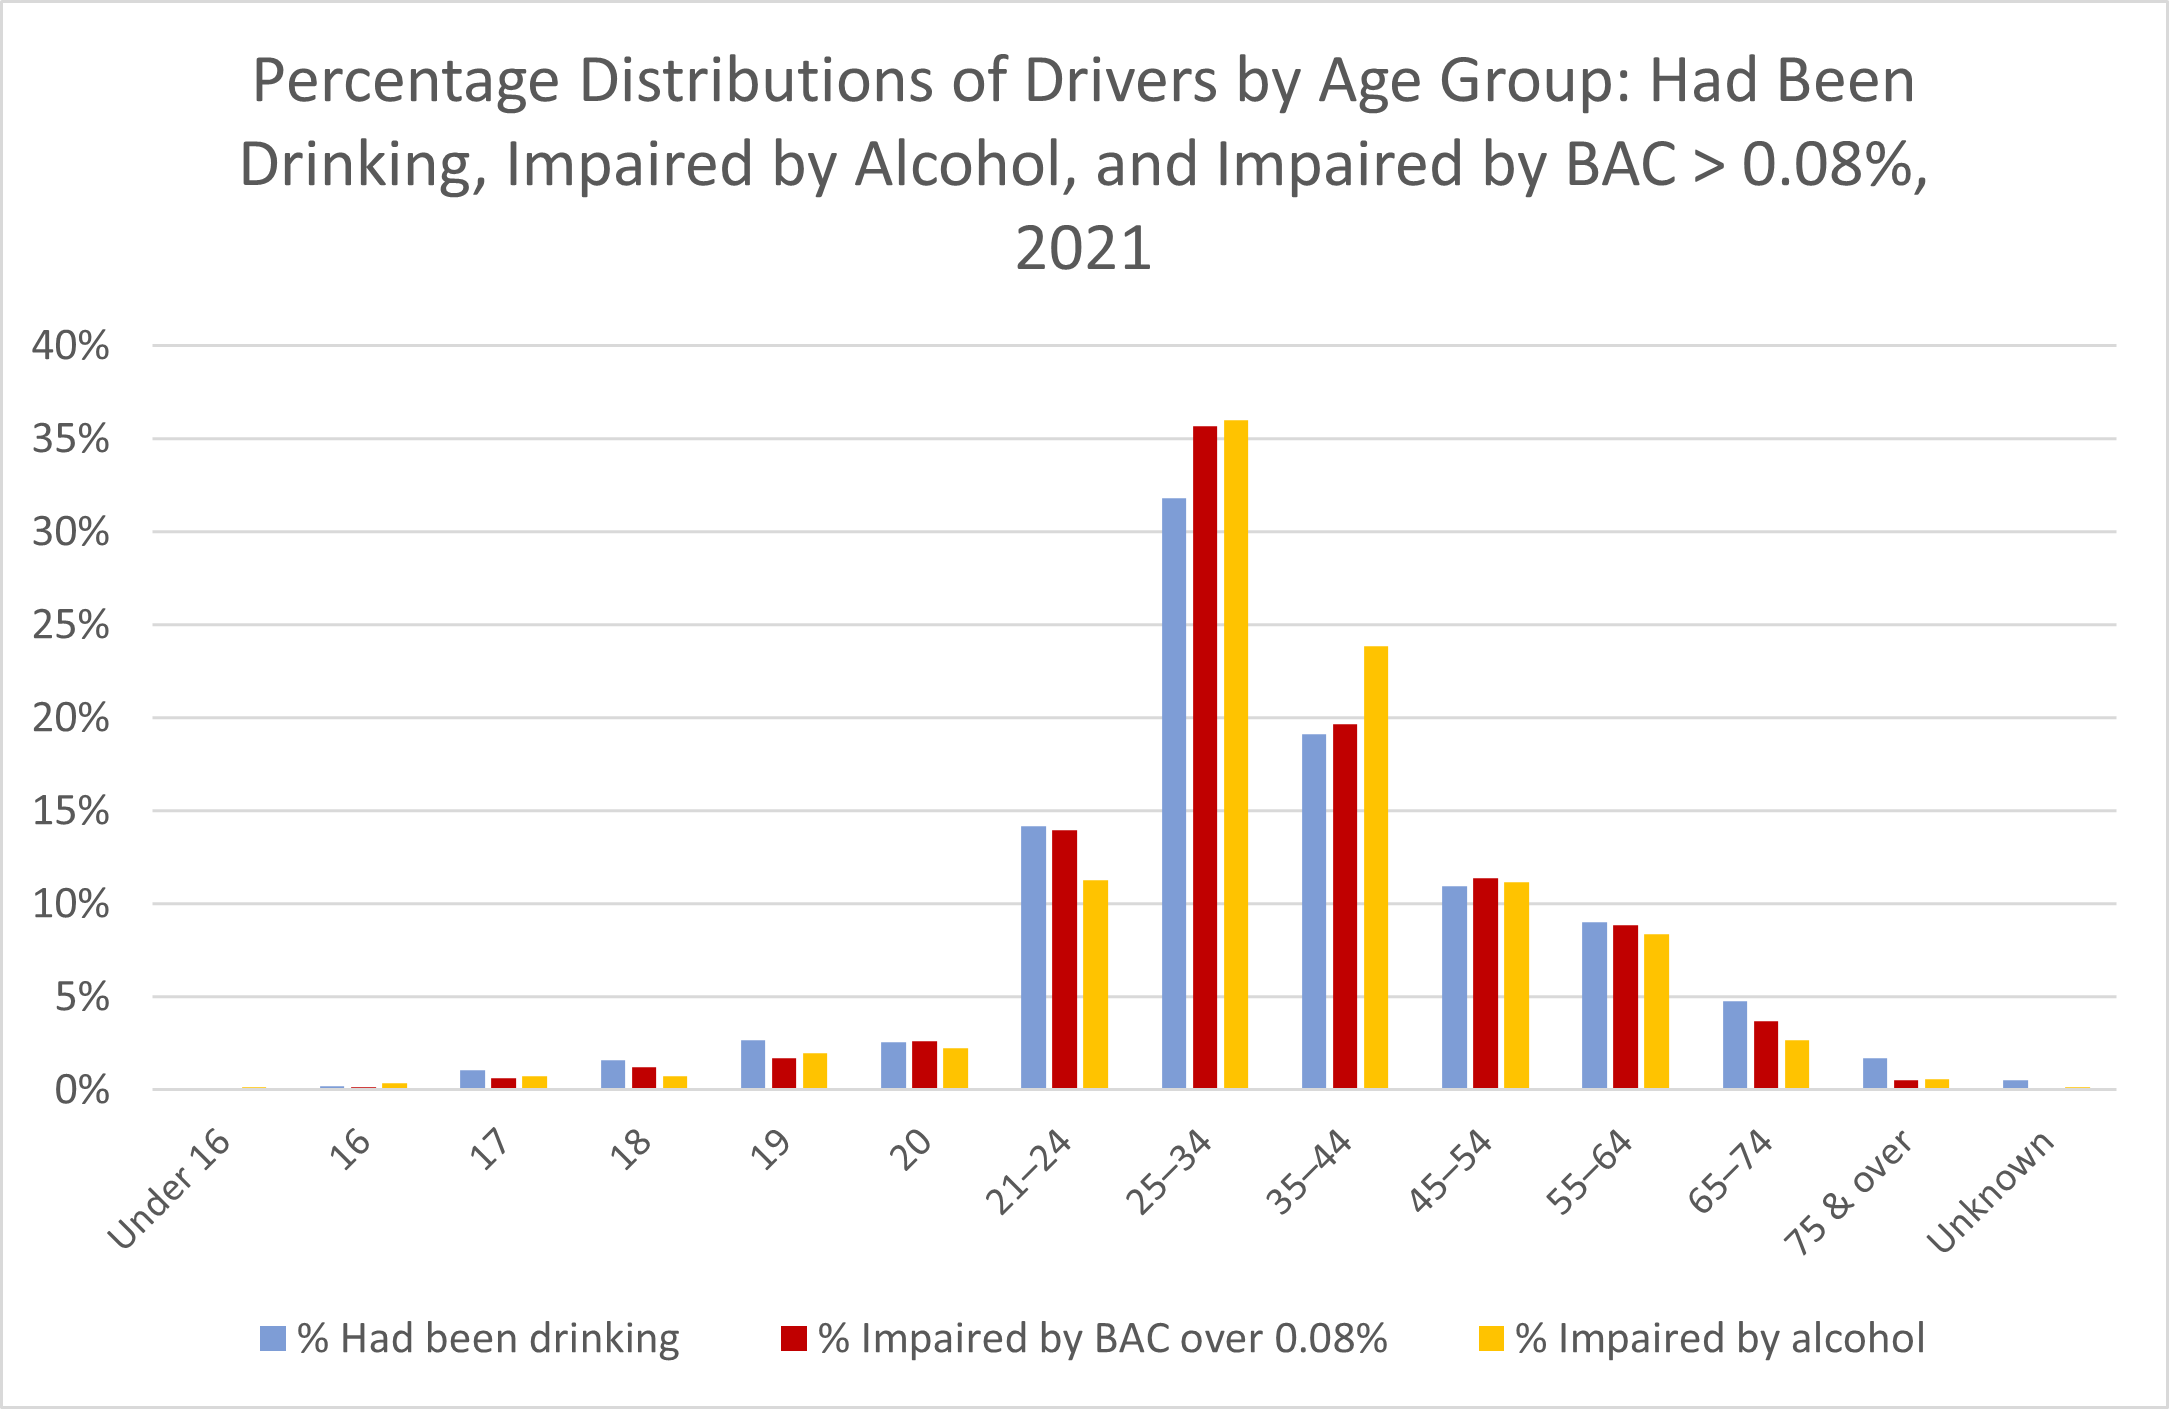
- The following chart shows the distributions by age group of drivers involved in collisions in 2021 who had consumed alcohol before the crash. Three distributions are shown:
- Drivers who had consumed some alcohol but without becoming demonstrably impaired (1,132 collisions)
- Drivers who had consumed enough alcohol to become impaired (861 collisions)
- Drivers whose blood alcohol content (BAC) was over 0.08% (the legal limit) (2,055 collisions)
A larger percentage of drivers aged 25 to 34 had consumed alcohol in each of these categories than drivers in any other age group. Drivers under 17 and those older than 74 were the least likely to consume alcohol. The correlation coefficients for all three pairs of distributions exceed 0.995, indicating that these three distributions are very well correlated with each other. Note: Even though it is illegal in Ontario for persons under 19 years of age to consume alcohol, a total of 89 drivers under 19 years of age did so before the collision. (Ontario Ministry of Transportation, 2024a)
- Car drivers aren’t the only road users in crashes who are impaired by alcohol or drugs. In 2021, alcohol consumption was a contributing factor in 1.9% of fatal truck collisions and 18.7% of fatal motorcycle collisions. Also, 20 (16%) of 121 fatally injured pedestrians were impaired by alcohol, and 24 (20%) of fatally injured pedestrians were impaired by drugs. (Ontario Ministry of Transportation, 2024)